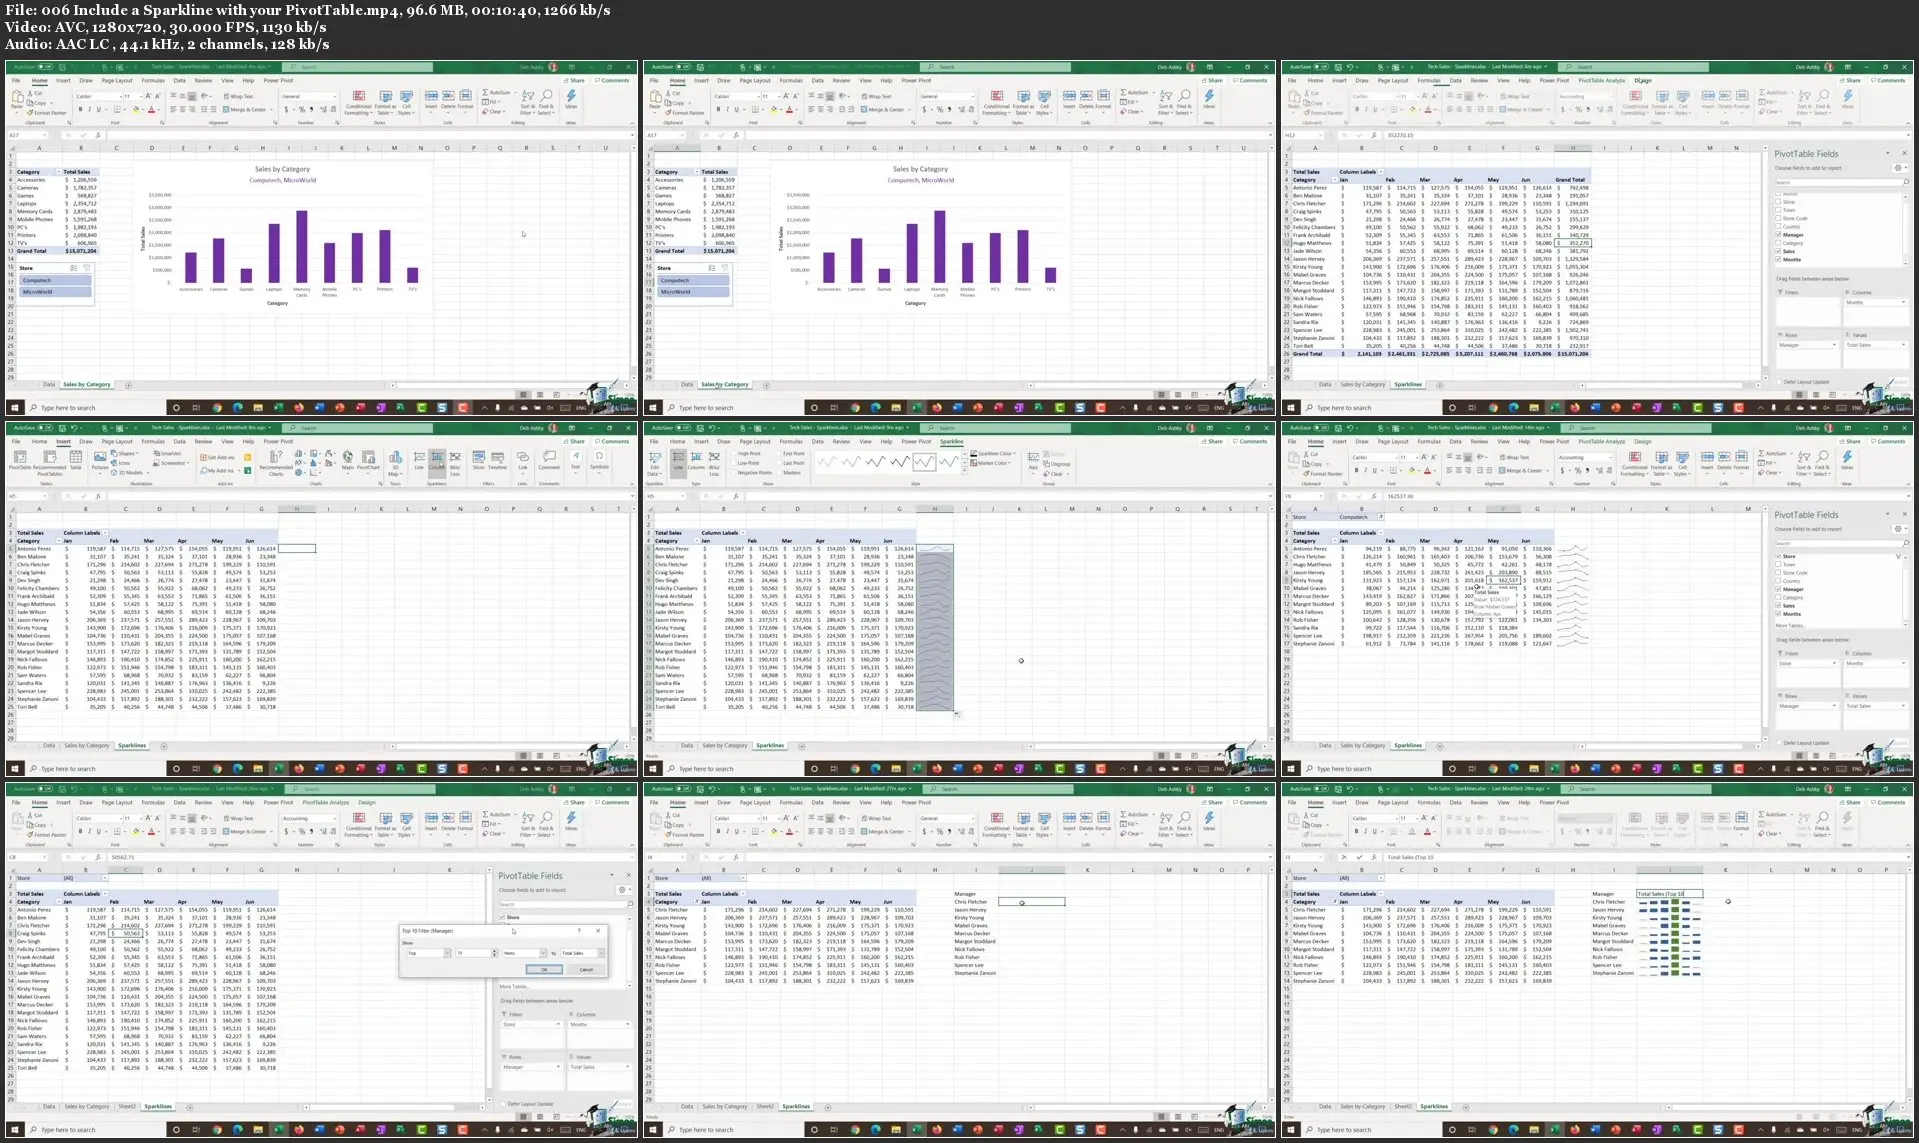
The Microsoft Excel Data Analysis Toolkit Bundle
The Microsoft Excel Data Analysis Toolkit Bundle
.MP4, AVC, 1280x720, 30 fps | English, AAC, 2 Ch | 25h 3m | 13.15 GB
Instructor: Deborah Ashby, Simon Sez IT
.MP4, AVC, 1280x720, 30 fps | English, AAC, 2 Ch | 25h 3m | 13.15 GB
Instructor: Deborah Ashby, Simon Sez IT
Conquer Data Analysis in Excel with four-comprehensive Excel courses in one
What you'll learn
How to merge data from different sources using VLOOKUP, HLOOKUP, INDEX MATCH, and XLOOKUP
How to use IF, IFS, IFERROR, SUMIF, and COUNTIF to apply logic to your analysis
How to split data using text functions SEARCH, LEFT, RIGHT, MID
How to standardize and clean data ready for analysis in Excel
Conducting a Linear Forecast and Forecast Smoothing in Excel
All about Histograms and Regression in Excel
How to use Goal Seek, Scenario Manager, and Solver to fill data gaps in Excel
Averages, percentiles, and LINEST functions
Sparklines and data bars
Importing data from other data sources
Advanced data analysis techniques
Financial & Statistical Functions
How to create amazing looking dashboards using Pivot Tables
How to format a PivotTable, including adjusting styles
Advanced Sorting and Filtering in PivotTables
How to use 3D Maps from a PivotTable
How to update your data in a PivotTable and Pivot Chart
Create multi-dependent dynamic drop-down lists in Excel
Perform a 2-way lookup in Excel
Automate repetitive tasks in Excel using Macros
How to edit Macros in the VBA Editor
How to write your own macro from scratch
Requirements
Microsoft Excel for Windows. The course was created using Excel 2019/365 for Windows. All of the code used in this course except for one property is compatible for Excel 2007, Excel 2010, Excel 2013, Excel 2016 and Excel 2019.
Intermediate knowledge of Microsoft Excel..
Description
Data Analysis is THE skill you need to thrive in the modern workforce.
Data Analysis is easier than you might think. You don’t need to be able to code or understand algorithms. What you need, is a deep understanding of the Microsoft Excel techniques needed to conduct comprehensive data analysis.
In this four-course bundle, we look at a number of advanced Excel techniques all aimed at helping you make sense of the numbers in your business.
In this special course, we’ve combined four of our full-length titles into one, huge-value bundle. Here’s what you get:
Excel for Business Analysts
What you’ll learn:
How to merge data from different sources using VLOOKUP, HLOOKUP, INDEX MATCH, and XLOOKUP
How to use IF, IFS, IFERROR, SUMIF, and COUNTIF to apply logic to your analysis
How to split data using text functions SEARCH, LEFT, RIGHT, MID
How to standardize and clean data ready for analysis
About using the PivotTable function to perform data analysis
How to use slicers to draw out information
How to display your analysis using Pivot Charts
All about forecasting and using the Forecast Sheets
Conducting a Linear Forecast and Forecast Smoothing
How to use Conditional Formatting to highlight areas of your data
All about Histograms and Regression
How to use Goal Seek, Scenario Manager, and Solver to fill data gaps
Advanced Excel 2019 Course
What You'll Learn:
What's new/different in Excel 2016
Advanced charting and graphing in Excel
How to use detailed formatting tools
Lookup and advanced lookup functions
Financial functions including calculating interest and depreciation
Statistical functions
Connecting to other workbooks and datasets outside of Excel e.g. MS Access and the web.
How to create awesome visualizations using sparklines and data bars
Mastery of PivotTables and Pivot Charts
Scenario Manager, Goal Seek, and Solver
Advanced charts such as Surface, Radar, Bubble, and Stock Charts
Advanced PivotTables
What You'll Learn:
How to do a PivotTable (a quick refresher)
How to combine data from multiple worksheets for a PivotTable
Grouping, ungrouping, and dealing with errors
How to format a PivotTable, including adjusting styles
How to use the Value Field Settings
Advanced Sorting and Filtering in PivotTables
How to use Slicers, Timelines on multiple tables
How to create a Calculated Field
All about GETPIVOTDATA
How to create a Pivot Chart and add sparklines and slicers
How to use 3D Maps from a PivotTable
How to update your data in a PivotTable and Pivot Chart
All about Conditional Formatting in a PivotTable
How to create amazing looking dashboards
Advanced Formulas in Excel
What You'll Learn:
Filter a dataset using a formula
Sort a dataset using formulas and defined variables
Create multi-dependent dynamic drop-down lists
Perform a 2-way lookup
Make decisions with complex logical calculations
Extract parts of a text string
Create a dynamic chart title
Find the last occurrence of a value in a list
Look up information with XLOOKUP
Find the closest match to a value
This course was recorded using Excel 2019 and Excel 365. It's also relevant to those using other, recent versions of Microsoft Excel including Excel 2013 and 2016.
Who this course is for:
Those wanting to automate Excel task or procedures.
Users with basic knowledge of Excel 2019/365 and those upgrading from previous software versions
Users who have a foundation of Microsoft Excel and seeking to advance their Excel 2019/365 knowledge.
The Microsoft Excel Data Analysis Toolkit Bundle