Research Methods: Excel At Survey Data Analysis Presentation

Research Methods: Excel At Survey Data Analysis Presentation
Video: .mp4 (1280x720, 30 fps(r)) | Audio: aac, 44100 Hz, 2ch | Size: 223 MB
Genre: eLearning Video | Duration: 12 lectures (37 mins) | Language: English
Video: .mp4 (1280x720, 30 fps(r)) | Audio: aac, 44100 Hz, 2ch | Size: 223 MB
Genre: eLearning Video | Duration: 12 lectures (37 mins) | Language: English
Hands-On Guide To Transforming Paper-Based Survey Data Into Useable Info & Presentation of Research Paper Study Results
What you'll learn
Survey Research Methodology: Survey Questionnaire Data-Entry Instruments Design
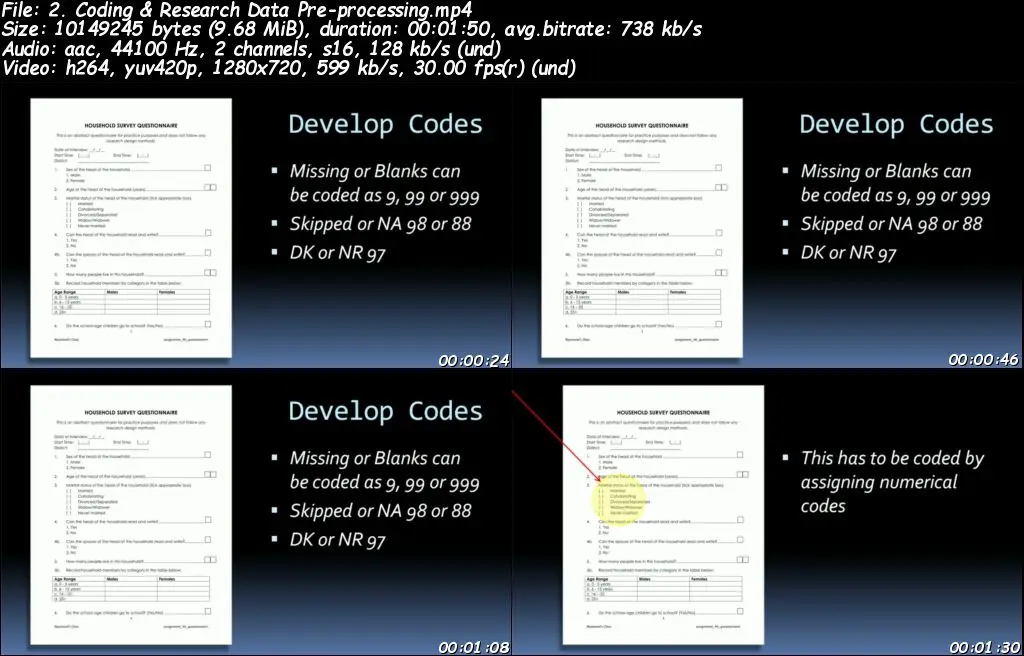
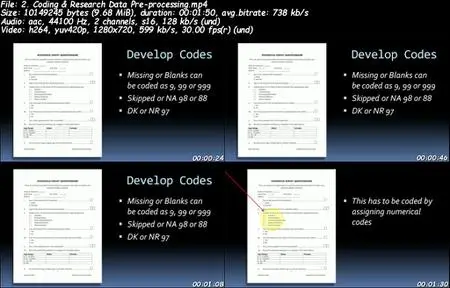
Survey Research Methodology: Preliminary Survey Questionnaire Data Pre-Processing & Data Coding
Survey Research Methodology: Data Entry & Data Cleaning
Quantitative Research Data Analysis and Results Presentation
Requirements
None
Description
Are you struggling with writing your findings or results chapter? Whether it's a dissertation, thesis or any other type of academic research paper assignment, this mini-course will get you off to a great start. The course focuses on teaching the basics of designing survey data-entry instruments, data analysis, cleaning up datasets and presentation of your quantitative research results using the free public domain statistical software package of EpiData. We all know that the results or findings chapter is all about statistical findings, which is basically numbers. That's the focus of the course, not question design or interpretation of survey data.
This practical comprehensive hands-on course targets undergraduate, post-graduate, MA or PhD students; program managers, monitoring & evaluation professionals or anyone who needs to perform research data or statistical analyses using questionnaires survey methodology where the data are subsequently transformed into tables and figures which gives you the first comprehensible results. Participants will be able to pick a basic and straightforward technical skillset to effectively summarize the results of their analysis and describe these results.
On completion of the course, participants will have the necessary familiarity with EpiData Software to move on to further EpiData courses or continue learning themselves.
Specifically we'll cover the 3 stages of data processing; namely:
Input – After data collection the raw data must be fed into the cycle for processing, is referred to as input.
Processing – Once the raw data is provided, it is processed using a suitable or chosen statistical tool. This is an important step because it outputs the processed data that will be used later.
Output – This is the result. The raw data that was provided in the first stage has now been "processed," and is now useful and informative, and it is no longer referred to as data.
Who this course is for:
Undergraduate, Post-graduate or PhD students
Project & Program managers
Monitoring & Evaluation Professionals
Beginner Researchers, looking to get data management skills
Course content
3 sections • 12 lectures • 37m total length
Research Methods: Excel At Survey Data Analysis Presentation