Statistical Process Control (SPC) Using Microsoft Excel
Statistical Process Control (SPC) Using Microsoft Excel
Video: .mp4 (1280x720, 30 fps(r)) | Audio: aac, 44100 Hz, 2ch | Size: 5.75 GB
Genre: eLearning Video | Duration: 91 lectures (10 hour, 49 mins) | Language: English
A Deep Dive into Analyzing your Process Data to Drive Quality Improvements within your Organization
Video: .mp4 (1280x720, 30 fps(r)) | Audio: aac, 44100 Hz, 2ch | Size: 5.75 GB
Genre: eLearning Video | Duration: 91 lectures (10 hour, 49 mins) | Language: English
A Deep Dive into Analyzing your Process Data to Drive Quality Improvements within your Organization
What you'll learn
Statistical Process Control
SPC
Pareto Analysis
Control Charting
Process Capability Analysis
Regression Analysis
Quality Engineering Statistics
Analytical problem solving methods
How SPC is a key component in the product design and manufacturing processes
Requirements
Manufacturing background is helpful
Microsoft Excel experience is helpful
Description
Statistical Process Control (SPC) Using Microsoft Excel is the one course you need to learn how to harness, analyze and report your manufacturing process data in a way that drives improvement within your organization. This course is divided into 4 major sections:
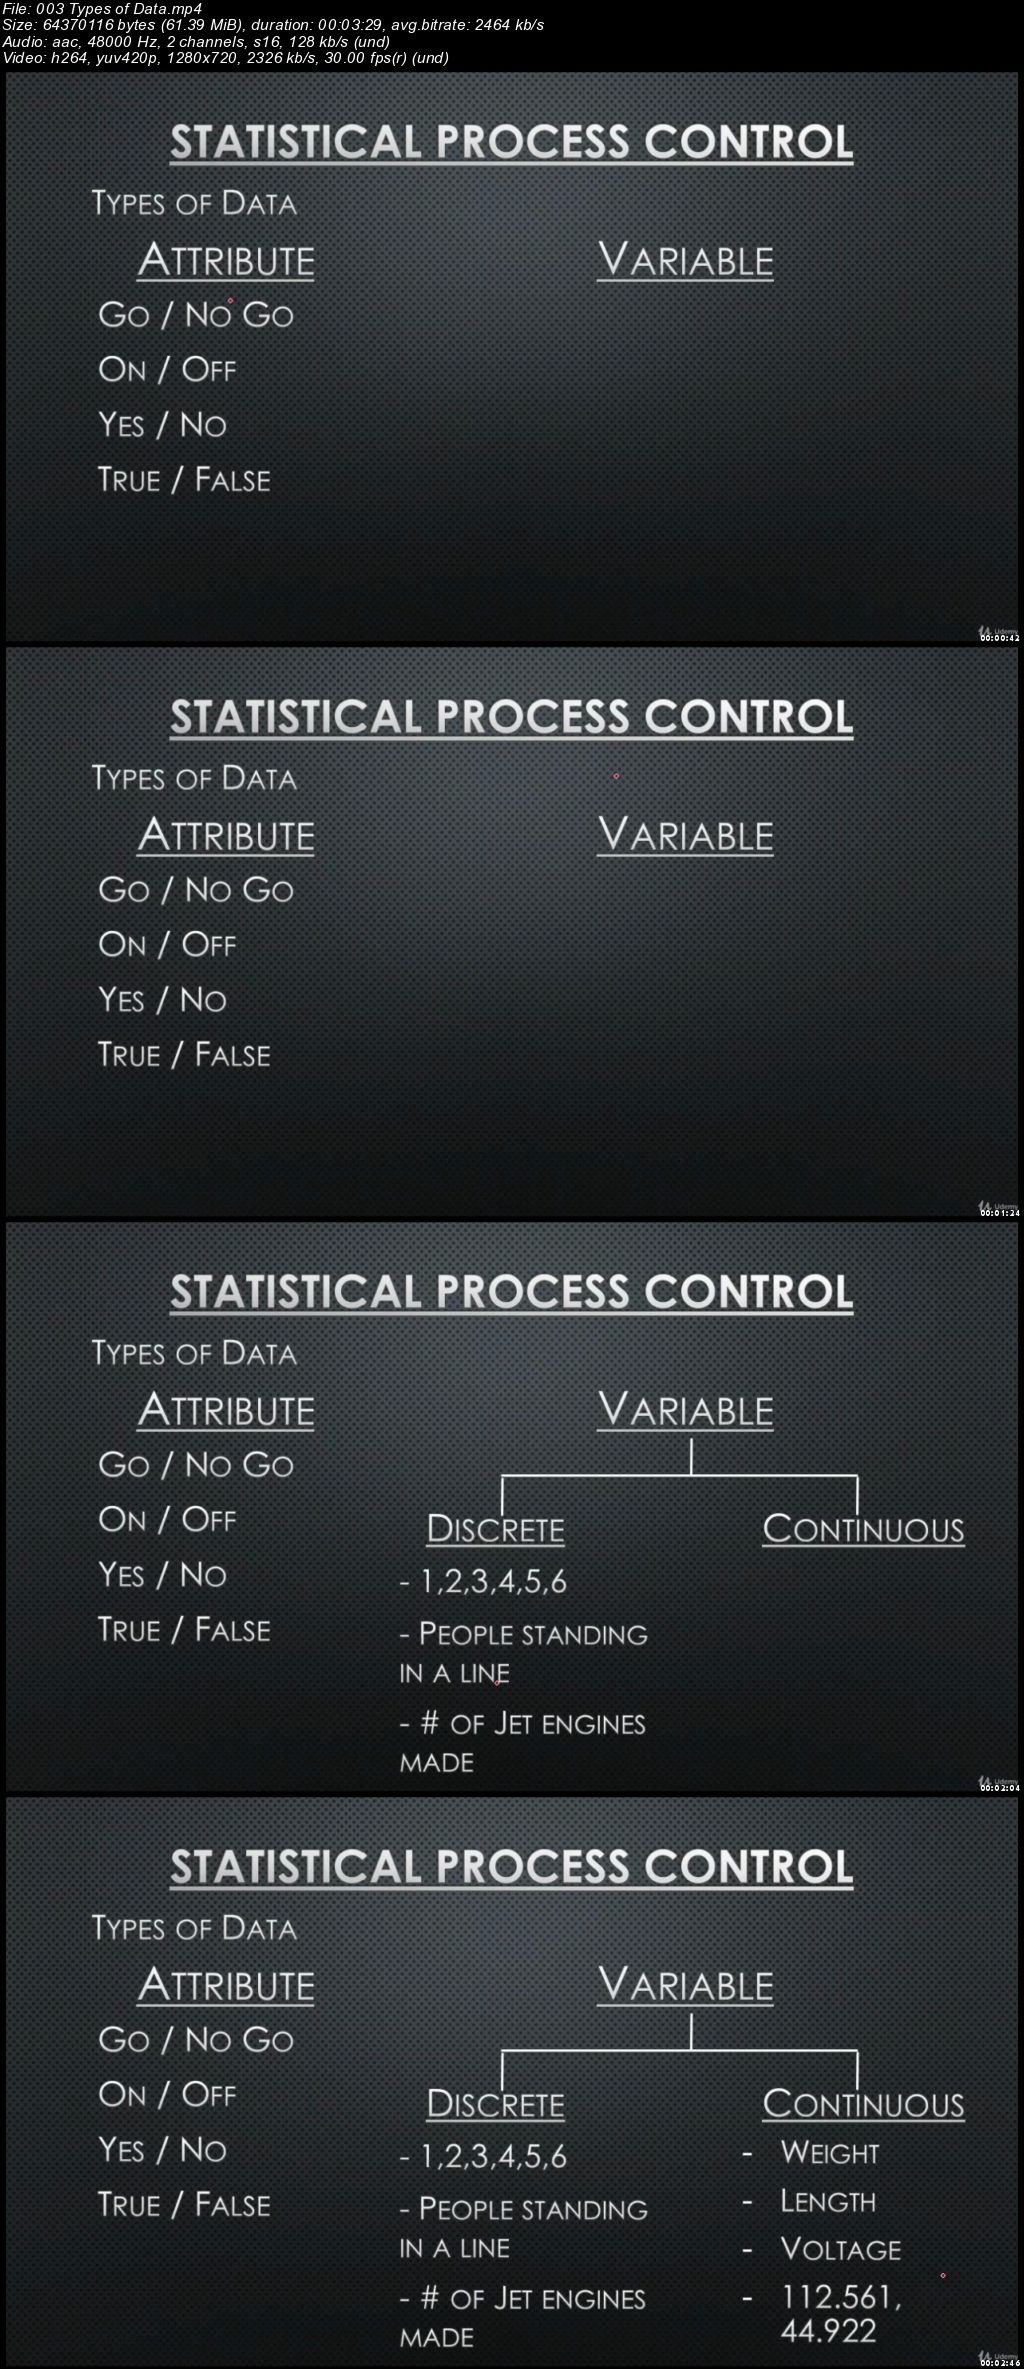
Basic Statistical Concepts: Don't worry if you've never studied statistics or are a novice using Excel. This course starts at the beginning. In this section, I explain fundamental concepts that you will use throughout this course and your career including Measures of Central Tendency, Measures of Dispersion and the different types and scales of data. Not only do I explain these concepts "on paper", but I'll take you into Excel and show you how to QUICKLY calculate the statistics you need.
Pareto Analysis: Most people do not realize the power of the Pareto Distribution. In this section, I will show you how to apply the so called "80/20 Rule" in remarkably expedient and innovative ways. I will also introduce you to Excel's Pivot Tables, which when combined with Pareto Analysis, form a powerful decision making tool for allocating your organization's capital, people and improvement effort.
Control Charting: Often considered the backbone of statistical process control, control charting allows you to graphically depict and then analyze your process and quality data. Control charting calculates the normal limits for any process, then makes obvious the trends and nuances in your process. Not only will I explain the "nut and bolts" of 7 different control charts for both variable and attribute data, but I will also walk you through the secrets of interpreting their results. You will also receive excellent reference tools and Excel reports you can use in your own improvement projects.
Regression Analysis: Regression Analysis is a remarkably powerful tool for defining the relationship between two or more variables, and then providing a formula you can use to make predictions about your own process. This section offers you the fundamentals of this immense family of statistical processes by detailing Simple Linear and Multiple Linear Regression analysis. These tools will not only allow to you analyze the inputs and outputs of your manufacturing processes, but also serve as a stepping stone into more advanced studies of the topic.
In this course, I provide you with all the theory, applications, Excel Worksheets and real life examples you need to take your analytical and problem solving skills to a whole new level.
And if you're preparing to take your ASQ Certified Quality Engineer, Certified Quality Technician, Certified Six Sigma Green Belt, Certified Six Sigma Black Belt exams, this class is an excellent starting point to develop the quality statistics skills you'll need to succeed.
Sign up today!!
Who this course is for:
Quality engineers
Quality technicians
Industrial engineers
Manufacturing professionals
Statistical Process Control (SPC) Using Microsoft Excel