Prometheus | The Complete Hands-On for Monitoring & Alerting

Prometheus | The Complete Hands-On for Monitoring & Alerting
Video: .mp4 (1280x720, 30 fps(r)) | Audio: aac, 44100 Hz, 2ch | Size: 2.73 GB
Genre: eLearning Video | Duration: 102 lectures (9 hour, 29 mins) | Language: English
Video: .mp4 (1280x720, 30 fps(r)) | Audio: aac, 44100 Hz, 2ch | Size: 2.73 GB
Genre: eLearning Video | Duration: 102 lectures (9 hour, 29 mins) | Language: English
Learn A to Z of Prometheus from Basic to ADVANCE level. A Complete Guide to Master the DevOps Monitoring & Alerting
What you'll learn
Learn Full In & Out of Prometheus toolkit with proper HANDS-ON examples from scratch.
Start with the implementation of Prometheus core concepts - Architecture, Installation, PromQL, Exporters, Functions, Operators, etc.
ADVANCE Prometheus concepts, the explanation to which is not very clear even in Prometheus' Official Documentation.
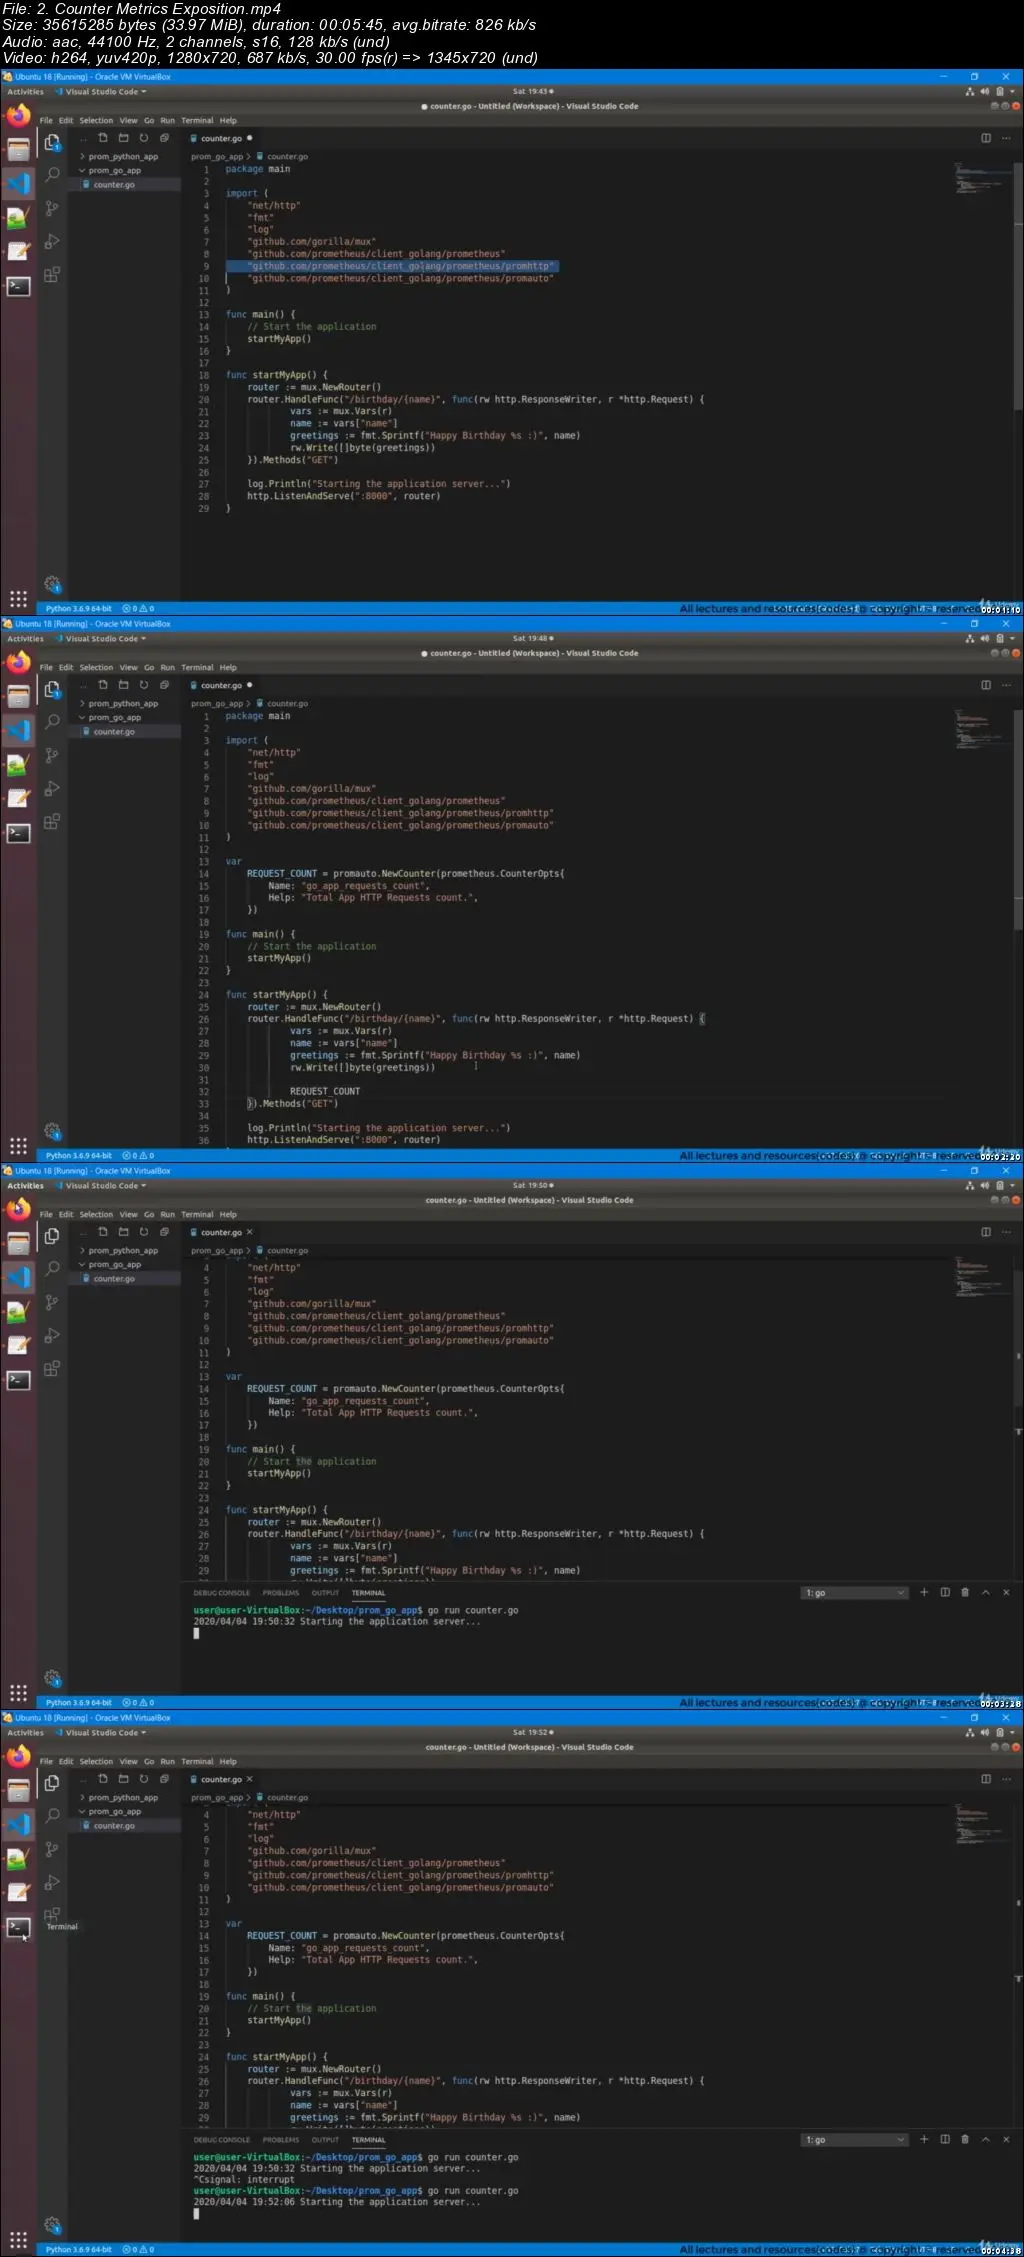
Instrument Python & Go web applications to expose Prometheus metrics with Client Libraries.
Implement the Monitoring & Alerting Design of Real-Time case studies using Prometheus.
Pushgateway, Service Discovery, Recording Rules, Routing Trees, Create Custom Exporter, HTTP API, and many more…
Monitor the Amazon Cloud (AWS) with Prometheus.
Integration with many Alert Notifiers - Gmail, PagerDuty, Slack.
Build value added dashboards with GRAFANA
Codes and Resources are available in resources tab. This will save your typing efforts.
Requirements
A very basic knowledge of YAML will be an add-on.
Rest everything on Prometheus is covered in this course with line to line explanations.
Description
"Prometheus is an open source tool used for event monitoring and alerting."
Prometheus has changed the way of monitoring systems and that is why it has become the Top-level project of Cloud Native Computing Foundation (CNCF).
What's included in the course ?
Complete Prometheus concepts explained from Scratch to ADVANCE with Real-Time implementation.
Each and every Prometheus concept is explained with HANDS-ON examples.
Includes each and every, even thin detail of Prometheus.
For every concept, first, we will cover its theoretical stuff, followed by their running example.
Include even those concepts, the explanation to which is not very clear even in Prometheus' Official Documentation.
Technicalities
Many (official & 3rd party) exporters.
In-and-out of Functions, Operators, Clauses, etc, in Prometheus Query Language (PromQL).
Instrument the Python or Go applications to expose custom metrics with Client Libraries.
Dynamically add or remove scrape targets using Service Discovery.
Recording Rules.
Monitor the Amazon Cloud (AWS) with Prometheus.
Creating an end to end Routing Tree for Alerting systems.
*Exclusive*- Create your own Custom Exporter
Integration with many Alert Notifiers - Gmail, PagerDuty, Slack.
How to scrape from batch jobs using Pushgateway.
Build monitoring & alerting design pattern of a Real-Time case study using Prometheus.
Build value added dashboards with GRAFANA.
Learn Best practices / Do's & Dont's to follow while monitoring in Real-Time DevOps Projects.
After completing this course, you can start working on any Prometheus project with full confidence.
Add-Ons
Questions and Queries will be answered very quickly.
Prometheus codes and other resources used in lectures are attached in the course for your convenience.
I am going to update it frequently, every time adding new components of Prometheus.
Who this course is for:
Experienced techies who want to add a hot & demanding technology in their technology stack.
DevOps Engineers who want to switch their career from conventional monitoring tools to a full-fledged monitoring system.
Prometheus | The Complete Hands-On for Monitoring & Alerting