Prometheus and Grafana: Visualizing Application Performance

Prometheus and Grafana: Visualizing Application Performance
.MP4, AVC, 1152x720, 30 fps | English, AAC, 2 Ch | 3h 10m | 369 MB
Instructor: Opeyemi Onikute
.MP4, AVC, 1152x720, 30 fps | English, AAC, 2 Ch | 3h 10m | 369 MB
Instructor: Opeyemi Onikute
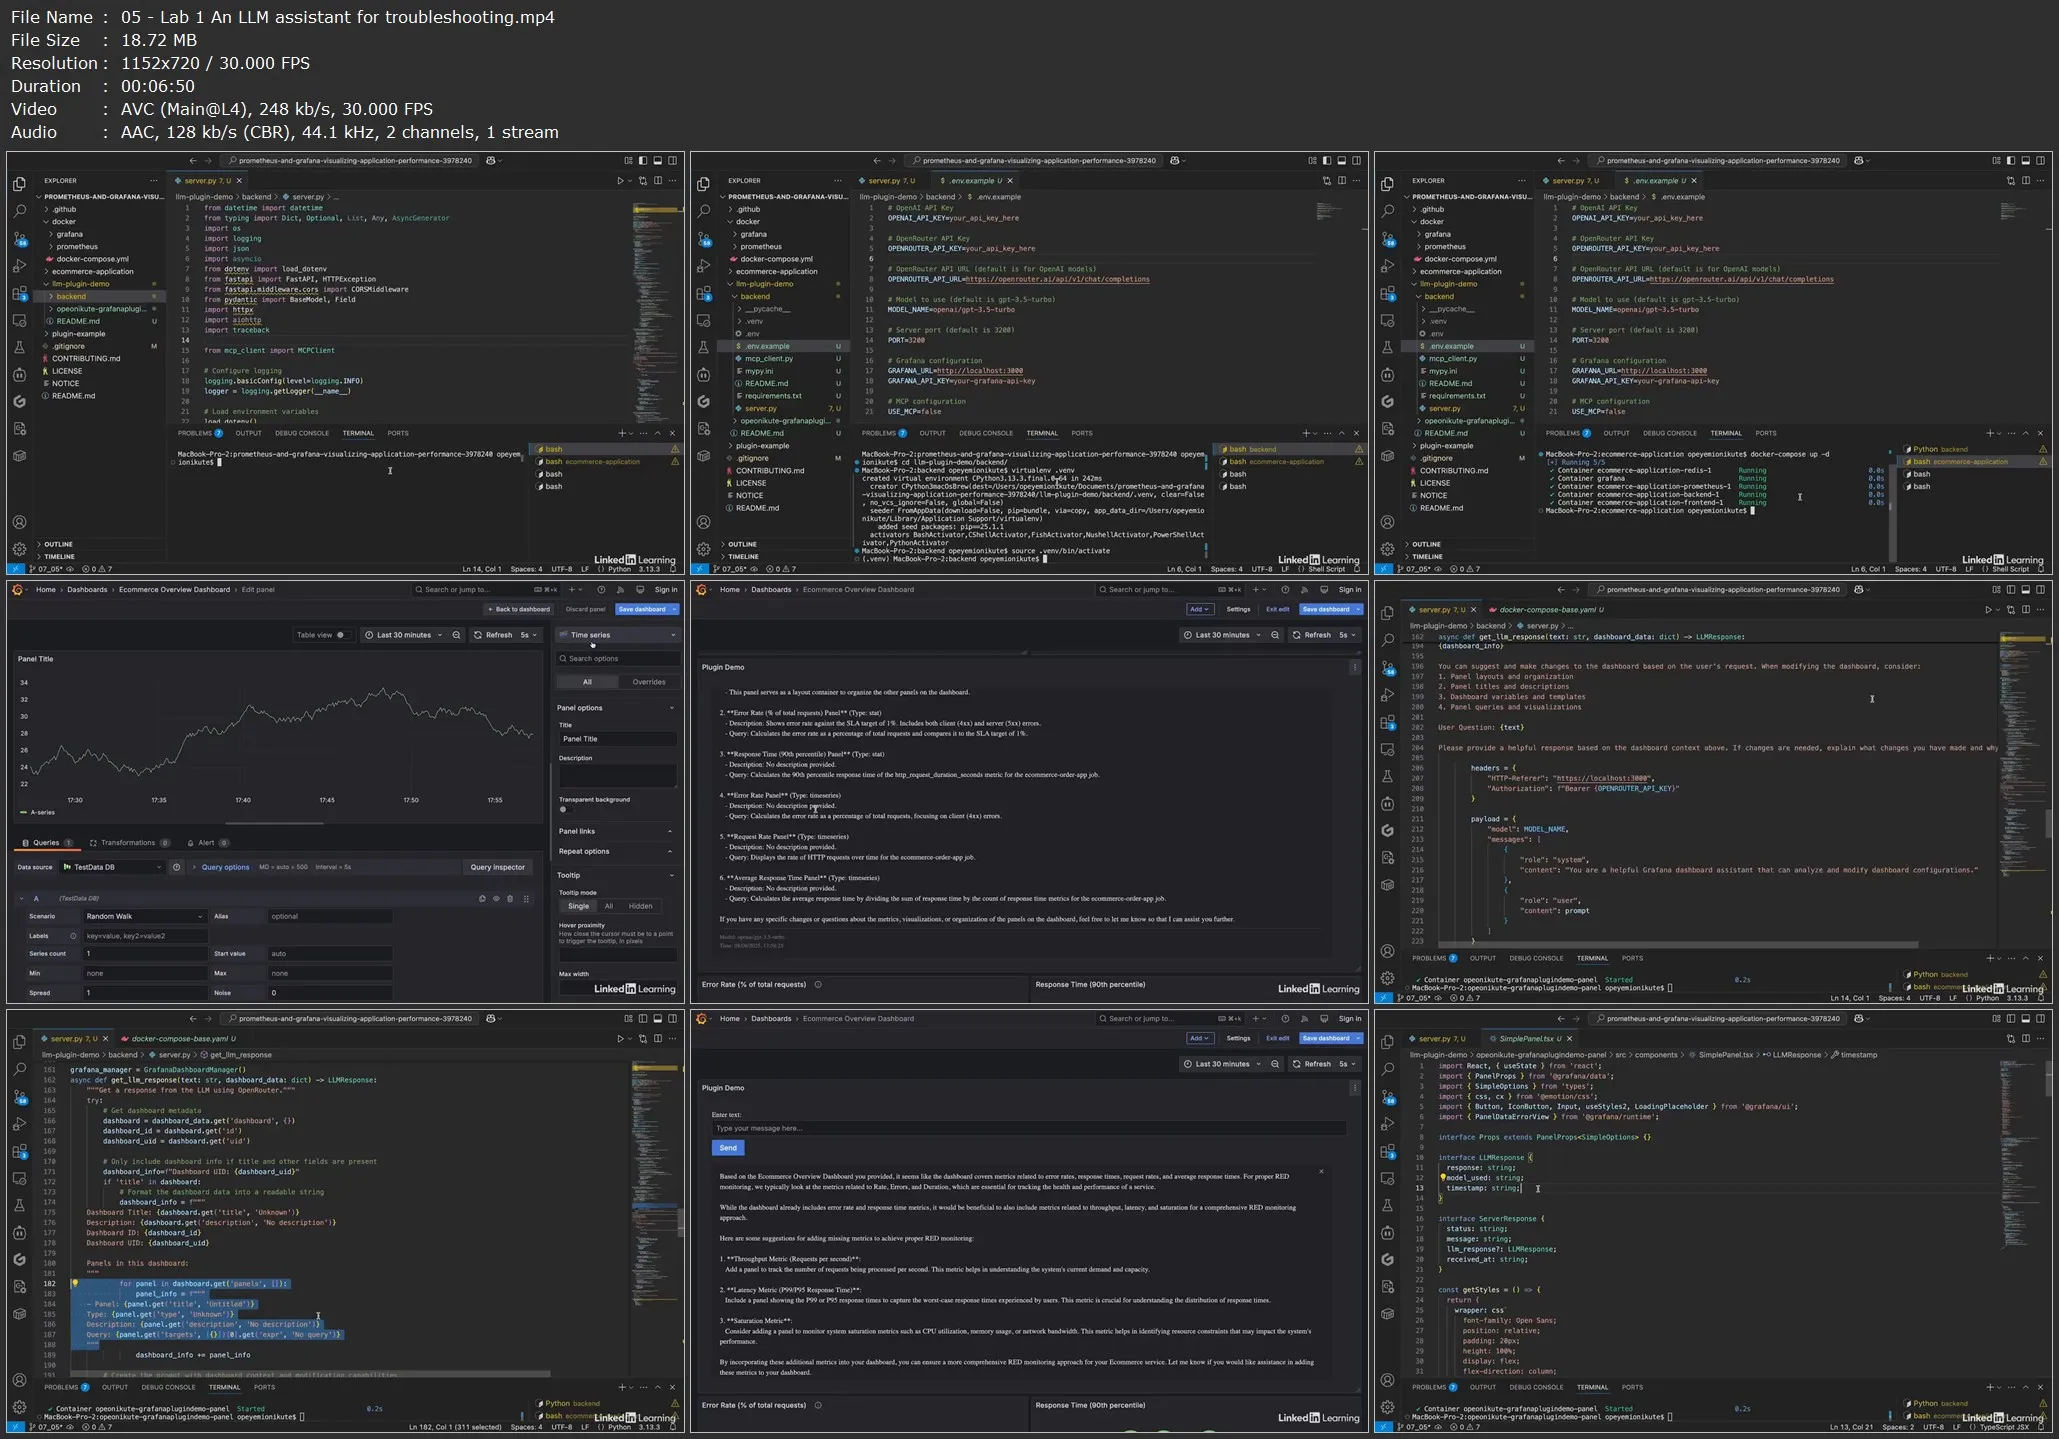
Whether you are already familiar with Grafana or a beginner, Systems Reliability Engineer (SRE) Opeyemi Onikute guides you through what you need to use Prometheus and Grafana to monitor and analyze applications in the real-world. Learn about Prometheus as a data source and explore all the tools you need to succeed with Grafana as a whole, including other data sources in the future. Beyond Grafana, find out how to create world-class dashboards as a whole.
Learning objectives
- Create and manage dashboards in Grafana with Prometheus.
- Understand how to create world-class dashboards beyond Grafana through study of dashboard structure and layout, presentation and design, and charting.
- Learn to manage Grafana dashboards automatically using infrastructure-as-code.
- Apply what you learn with practical examples in the real world.
- Understand the fundamental building blocks of Grafana such as panels, annotations, and queries.
Prometheus and Grafana: Visualizing Application Performance