Power BI and Dashboards for the Busy Professional

Power BI and Dashboards for the Busy Professional
Video: .mp4 (1280x720, 30 fps(r)) | Audio: aac, 44100 Hz, 2ch | Size: 1.93 GB
Genre: eLearning Video | Duration: 80 lectures (4 hour, 46 mins) | Language: English
How to build complex, insights-rich, interactive reports and dashboards in Power BI
Video: .mp4 (1280x720, 30 fps(r)) | Audio: aac, 44100 Hz, 2ch | Size: 1.93 GB
Genre: eLearning Video | Duration: 80 lectures (4 hour, 46 mins) | Language: English
How to build complex, insights-rich, interactive reports and dashboards in Power BI
What you'll learn
Microsoft Power BI for data analysis
Business Intelligence
Data Analysis
Requirements
Familiarity with Microsoft Excel
Some basic data analysis exposure
Description
This course is a fully hands-on one to take you from just having an idea of what Power BI does to being able to create insights-rich and interactive reports/dashboards in Power BI.
We cover the following aspects:
Get Data (bringing in your data for analysis)
Data Sources in Power BI Desktop
Connect to web data and web apps
Import Excel Workbooks
Connect to enterprise Database
Data Transformation, Power Query and DAX
Get Data
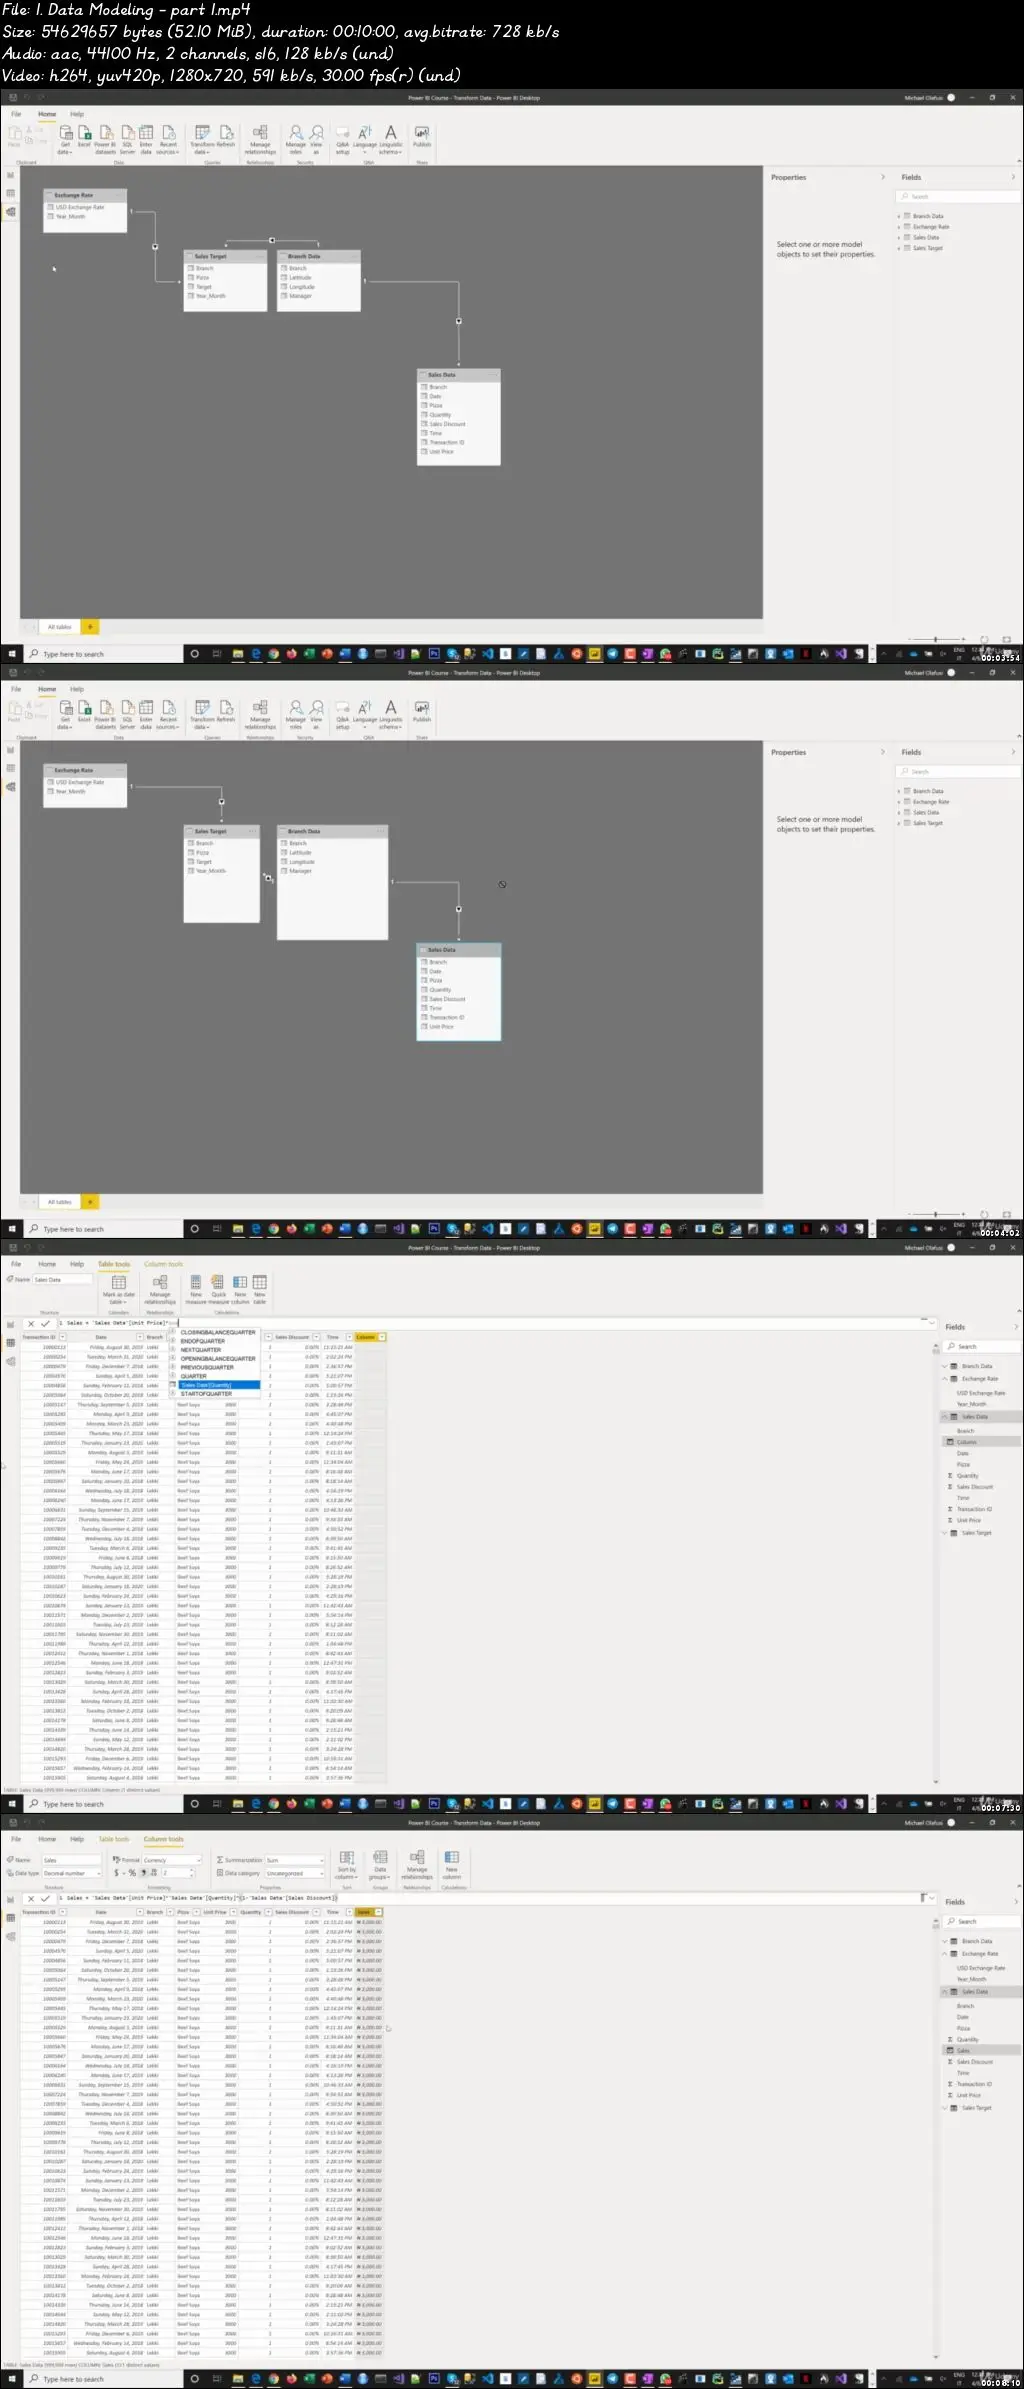
Model section of the report builder (Power BI Desktop)
Creating Relationships
Cardinality
Direction
Data section of the report builder (Power BI Desktop)
Data Type
Data Format
DAX
New Column
New Measure
New Table
Must know DAX formulas
DAX formula reference guide
Row level Security to control report access using roles (dept, function, branch, cost centre etc)
Report section of the report builder (Power BI Desktop)
Report creation
Native Visuals
Custom Visuals
Menu Tools for professional looking reports
Edit Interactions
Report creation from scratch
Power Query
Transforming and Combining Data before loading to Model
Common Power Query tasks
Unpivot
Pivot
Split Column
Append Tables
Merge Tables
Remove rows
Use first row as header
Merge Columns
Add Columns
Group By
Extract
Fill
Transpose
M Code reference resource
Report Publishing, Dashboards and Power BI Service
Understanding the concept of Workspaces
Publishing report (from Power BI desktop to Power BI service for consumption)
Controlling access to aspects of the report by role (region, department or level)
Published Report options
Exporting to PowerPoint or PDF
Embedding in SharePoint
Embedding in a website
Making it available via a web link
Sharing with specific users
Editing the report – adding new visuals, changing visuals used and creating new report pages
Adding comments and tagging users
Scheduling the report to send our daily or weekly to specific people
Creating a Dashboard
Can be created from one or more reports to show management useful analysis
Can incorporate data and visuals from other people’s dashboards or reports shared with you
Set Alerts to be instantly notified when a KPI is reached or an SLA is breached
Add actionable comments
Schedule the dashboard to be sent out daily or weekly to specific people
Share the dashboard with final users
Best practices
Setting automatic/scheduled refresh so new data is ingested automatically
Data Gateway configuration
The type of data sources that require data gateway
AI in Power BI and Settings
Q&A for autogenerating charts and tables in answer to questions
Organization wide settings
Account wide settings
Workspace settings
Dashboard settings
Report settings
Datasets settings
This is the course to solidify your Power BI proficiency.
Who this course is for:
Data Analysts
MIS Analysts
Financial Analysts
Project Managers
Supply Chain Analysts

Power BI and Dashboards for the Busy Professional