Creating Data Visualization with D3
Creating Data Visualization with D3
MP4 | Video: AVC 1280x720 | Audio: AAC 44KHz 2ch | Duration: 2.5 Hours | 569 MB
Genre: eLearning | Language: English
MP4 | Video: AVC 1280x720 | Audio: AAC 44KHz 2ch | Duration: 2.5 Hours | 569 MB
Genre: eLearning | Language: English
Do you want to make sense of your data? Do you want to create interactive charts, data trees, and geospatial charts efficiently?
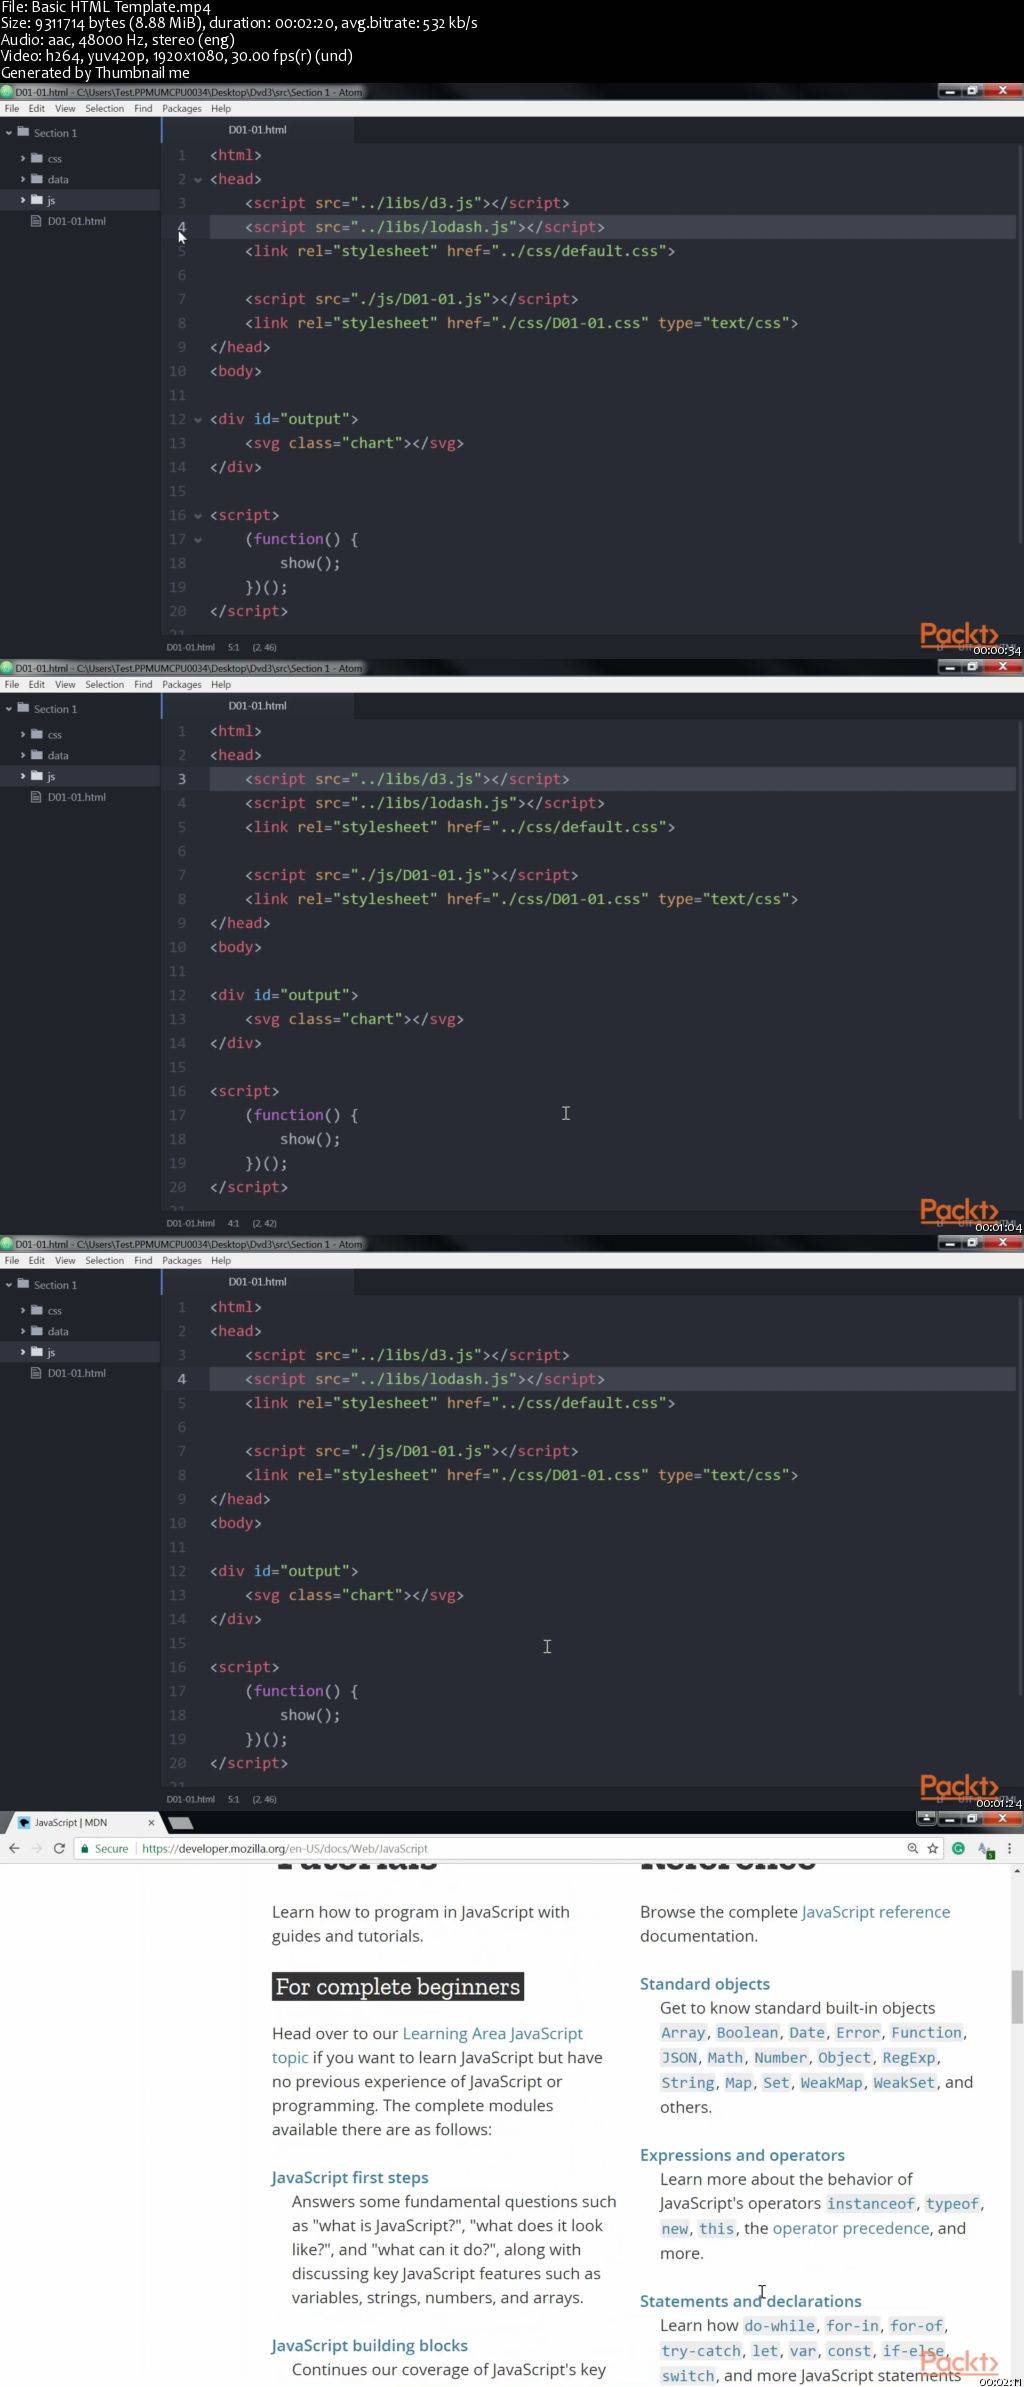
Well then, this course is your ideal choice to learn interactive data visualization with D3.js V4. It includes a number of extensive examples that to help you hone your skills with data visualization. Throughout five sections these examples will help you acquire a clear practical understanding of the various techniques, tools and functionality provided by D3.js. You will first setup your D3.JS development environment and learn the basic patterns needed to visualize your data. After that you will learn techniques to optimize different processes such animating data transitions, creating charts, and much more.
The course will also guide you through creating custom graphs and visualizations, and show you how to go from the raw data to beautiful visualizations. Towards the end of the course, you will learn to add more functionality on top of D3.js by using it with other external libraries and integrating it with ECMAScript 6.
All the code and supporting files for this course are available on Github at https://github.com/PacktPublishing/Creating-Data-Visualization-with-D3

Creating Data Visualization with D3