Learning Python Data Visualization
Learning Python Data Visualization
MP4 | Video: AVC 1280x720 | Audio: AAC 44KHz 2ch | Duration: 3 Hours | 565 MB
Genre: eLearning | Language: English
MP4 | Video: AVC 1280x720 | Audio: AAC 44KHz 2ch | Duration: 3 Hours | 565 MB
Genre: eLearning | Language: English
This video course is a beginner’s introduction to data visualization, and the techniques and libraries which can be leveraged with the Python language to achieve this. The end goal is to teach analysts and data scientists how they can visually represent complex sets of data using Python.
The video course introduces visualization concepts so viewers can analyze large and small sets of data using libraries such as Matplotlib, IPython, and so on.
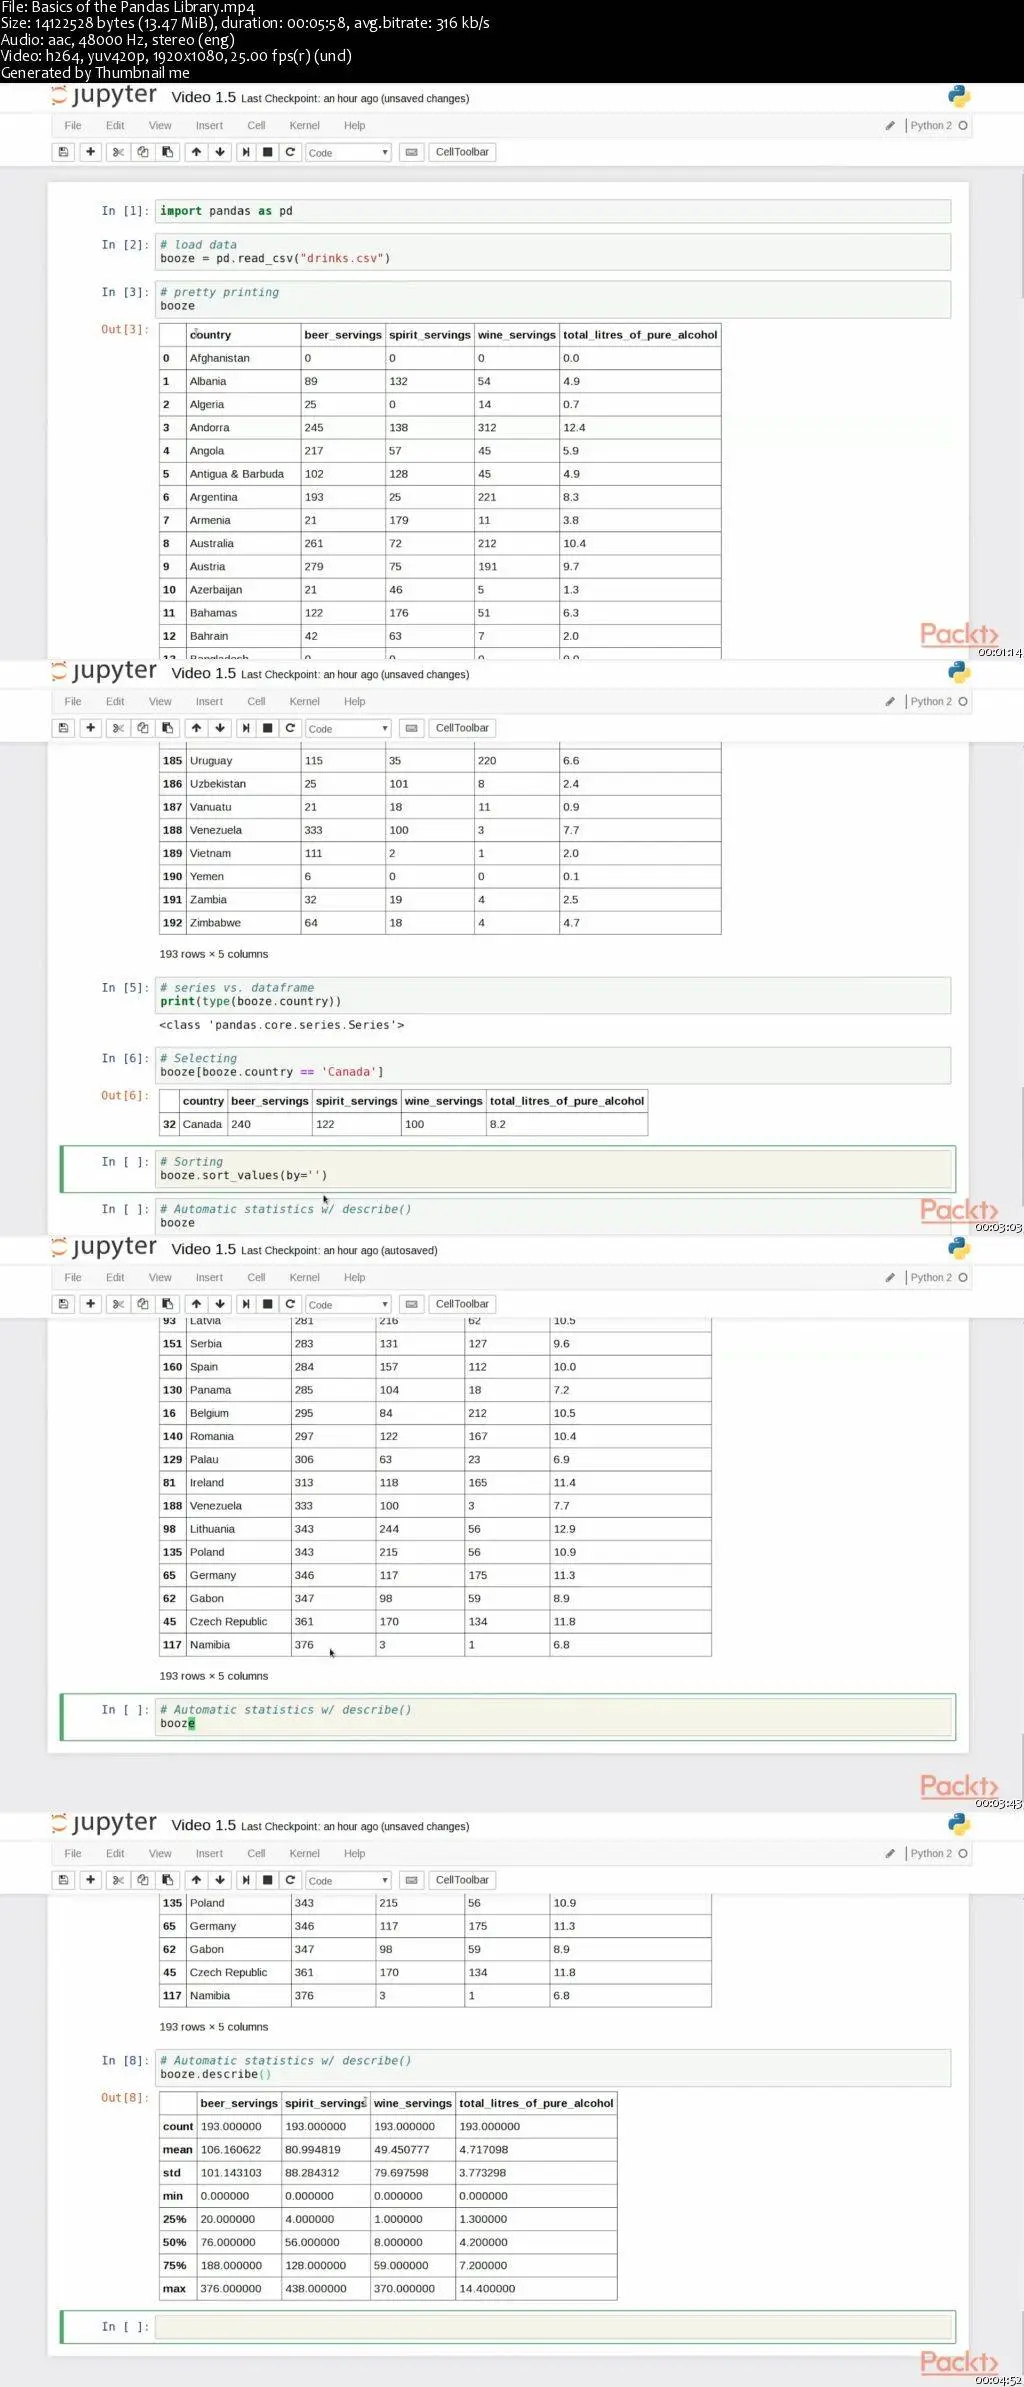
This course primarily employs the IPython environment and matplotlib, with the following structure:
Introduce key data visualization libraries (matplotlib and so on.) and cover data importing/exporting (CSV, Excel, JSON and so on).
Introduce real-world data sets (to be visualized in the video).
Visualization types/techniques (bar chart, histogram, scatter plot, geospatial, and so on); demonstrate how to customize visualizations.
Introduce intermediate topics to create more advanced visualizations and using complex techniques, such as real-time data visualization.
By the end of the course, you will be able to demonstrate visualizations with interesting, real-world data sets.
The code bundle for this video course is available at- https://github.com/PacktPublishing/Learning-Python-Data-Visualization
Learning Python Data Visualization