Making Graphs in Python using Matplotlib for Beginners
Making Graphs in Python using Matplotlib for Beginners
MP4 | Video: AVC 1280x720 | Audio: AAC 44KHz 2ch | Duration: 1.5 Hours | Lec: 10 | 321 MB
Genre: eLearning | Language: English
MP4 | Video: AVC 1280x720 | Audio: AAC 44KHz 2ch | Duration: 1.5 Hours | Lec: 10 | 321 MB
Genre: eLearning | Language: English
Learn how to start visualizing all your data directly in your code
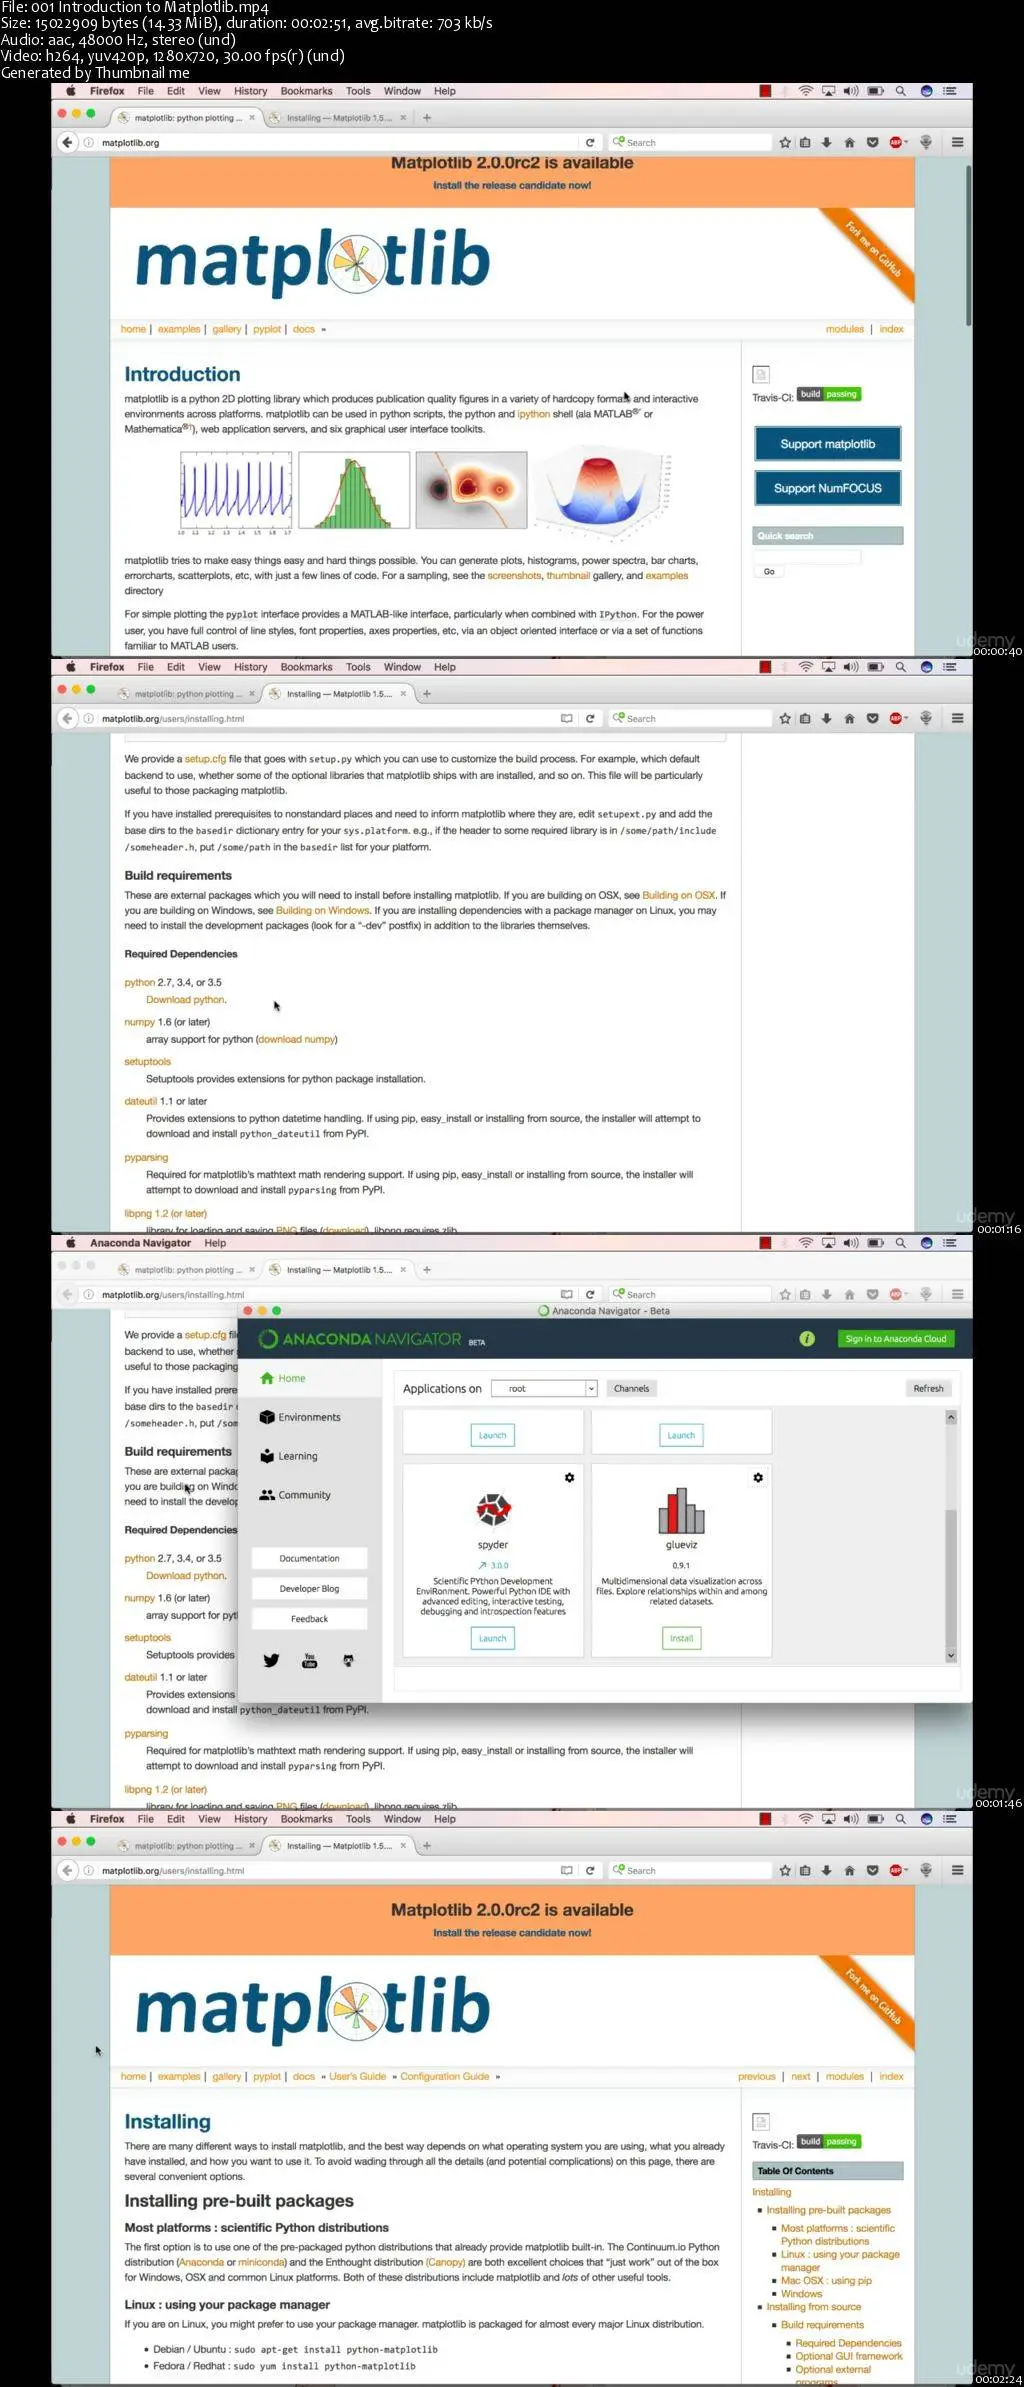
Data and analytics are becoming increasingly important in our world and in modern day businesses. To start off with data analytics (and ultimately provide nice images of our results), we need to be able to plot our data, preferably in the way we imagine it in our heads.
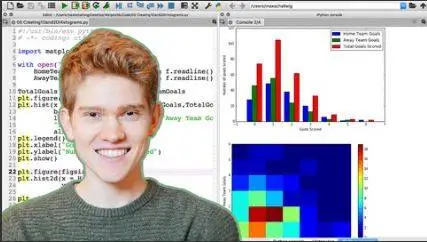
Matplotlib provides many great plotting opportunities and methods for data visualization, and in this course we will be looking at some introductory methods for getting started with creating plots in Python.
Once we have a starting point for plotting data we can easily expand our knowledge to different areas to make sure we can best represent all of our data.
Making Graphs in Python using Matplotlib for Beginners