DC.js for Data Science Essential Training (2017)

DC.js for Data Science Essential Training
MP4 | Video: AVC 1280x720 | Audio: AAC 48KHz 2ch | Duration: 5 Hours | 1.10 GB
Genre: eLearning | Language: English
MP4 | Video: AVC 1280x720 | Audio: AAC 48KHz 2ch | Duration: 5 Hours | 1.10 GB
Genre: eLearning | Language: English
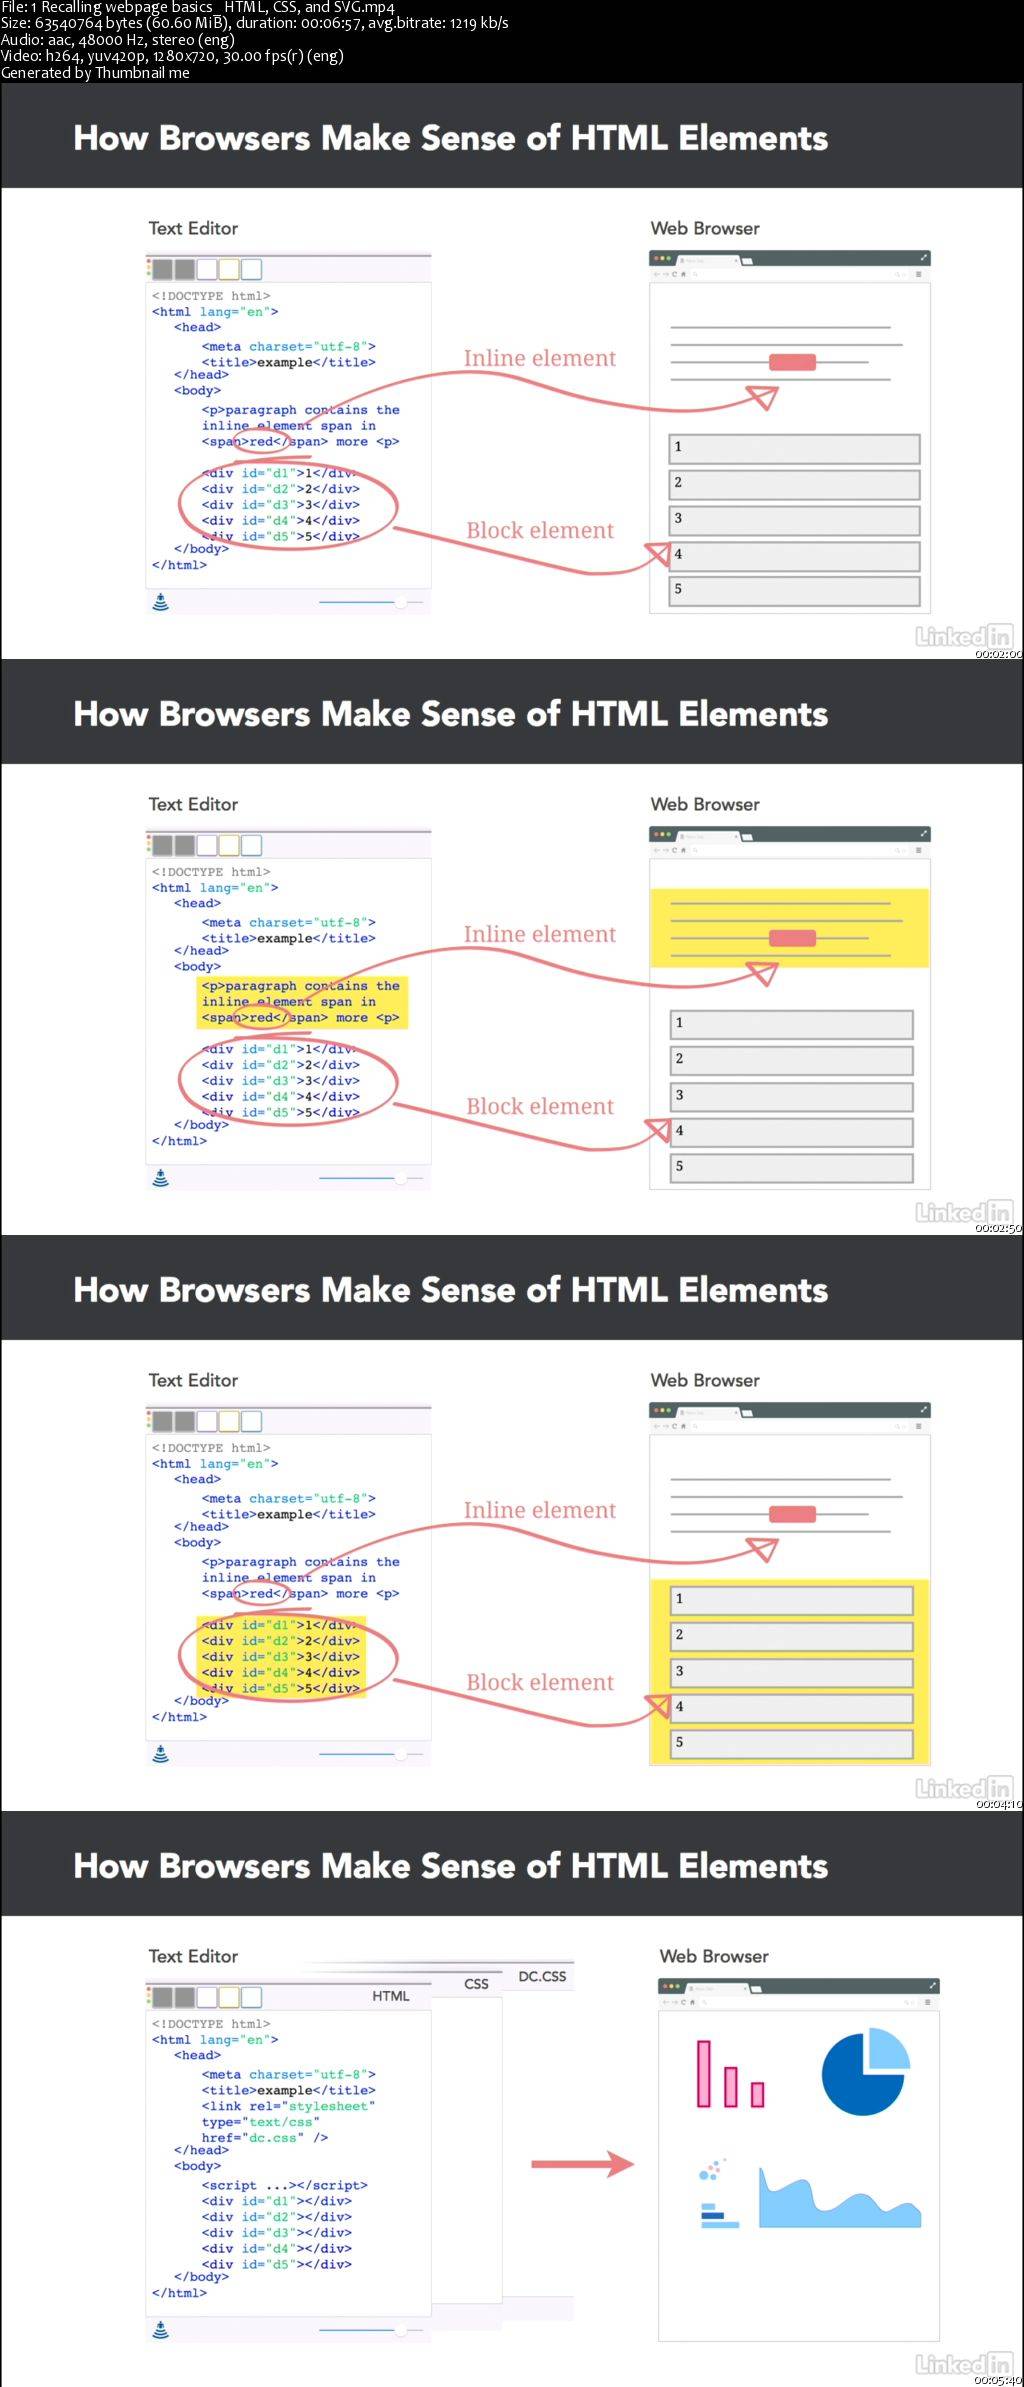
Dimensional charting (DC) allows data visualization to display in dashboard widgets as bar charts, scatterplots, heat maps, and more. DC.js is an open source JavaScript library based on Crossfilter and D3.js. In this course, learn how to build interactive, web-based dashboards. Instructor Emma Saunders covers all 20 built-in classes, the suite of included chart types, and the built-in formatting options available in DC.js. Learn how to use jQuery and bootstrap, apply filters, restyle existing dashboards, create custom charts, pair data using DC and D3, link charts, and more.
DC.js for Data Science Essential Training (2017)