Excel Power Map A Power BI Tool for Reporting Professionals

Excel Power Map A Power BI Tool for Reporting Professionals
MP4 | Video: AVC 1280x720 | Audio: AAC 44KHz 2ch | Duration: 36M | 138 MB
Genre: eLearning | Language: English
MP4 | Video: AVC 1280x720 | Audio: AAC 44KHz 2ch | Duration: 36M | 138 MB
Genre: eLearning | Language: English
Learn Excel Power Map, a 3-D data visualization tool to look information in new way that you can't see with 2-D charts.
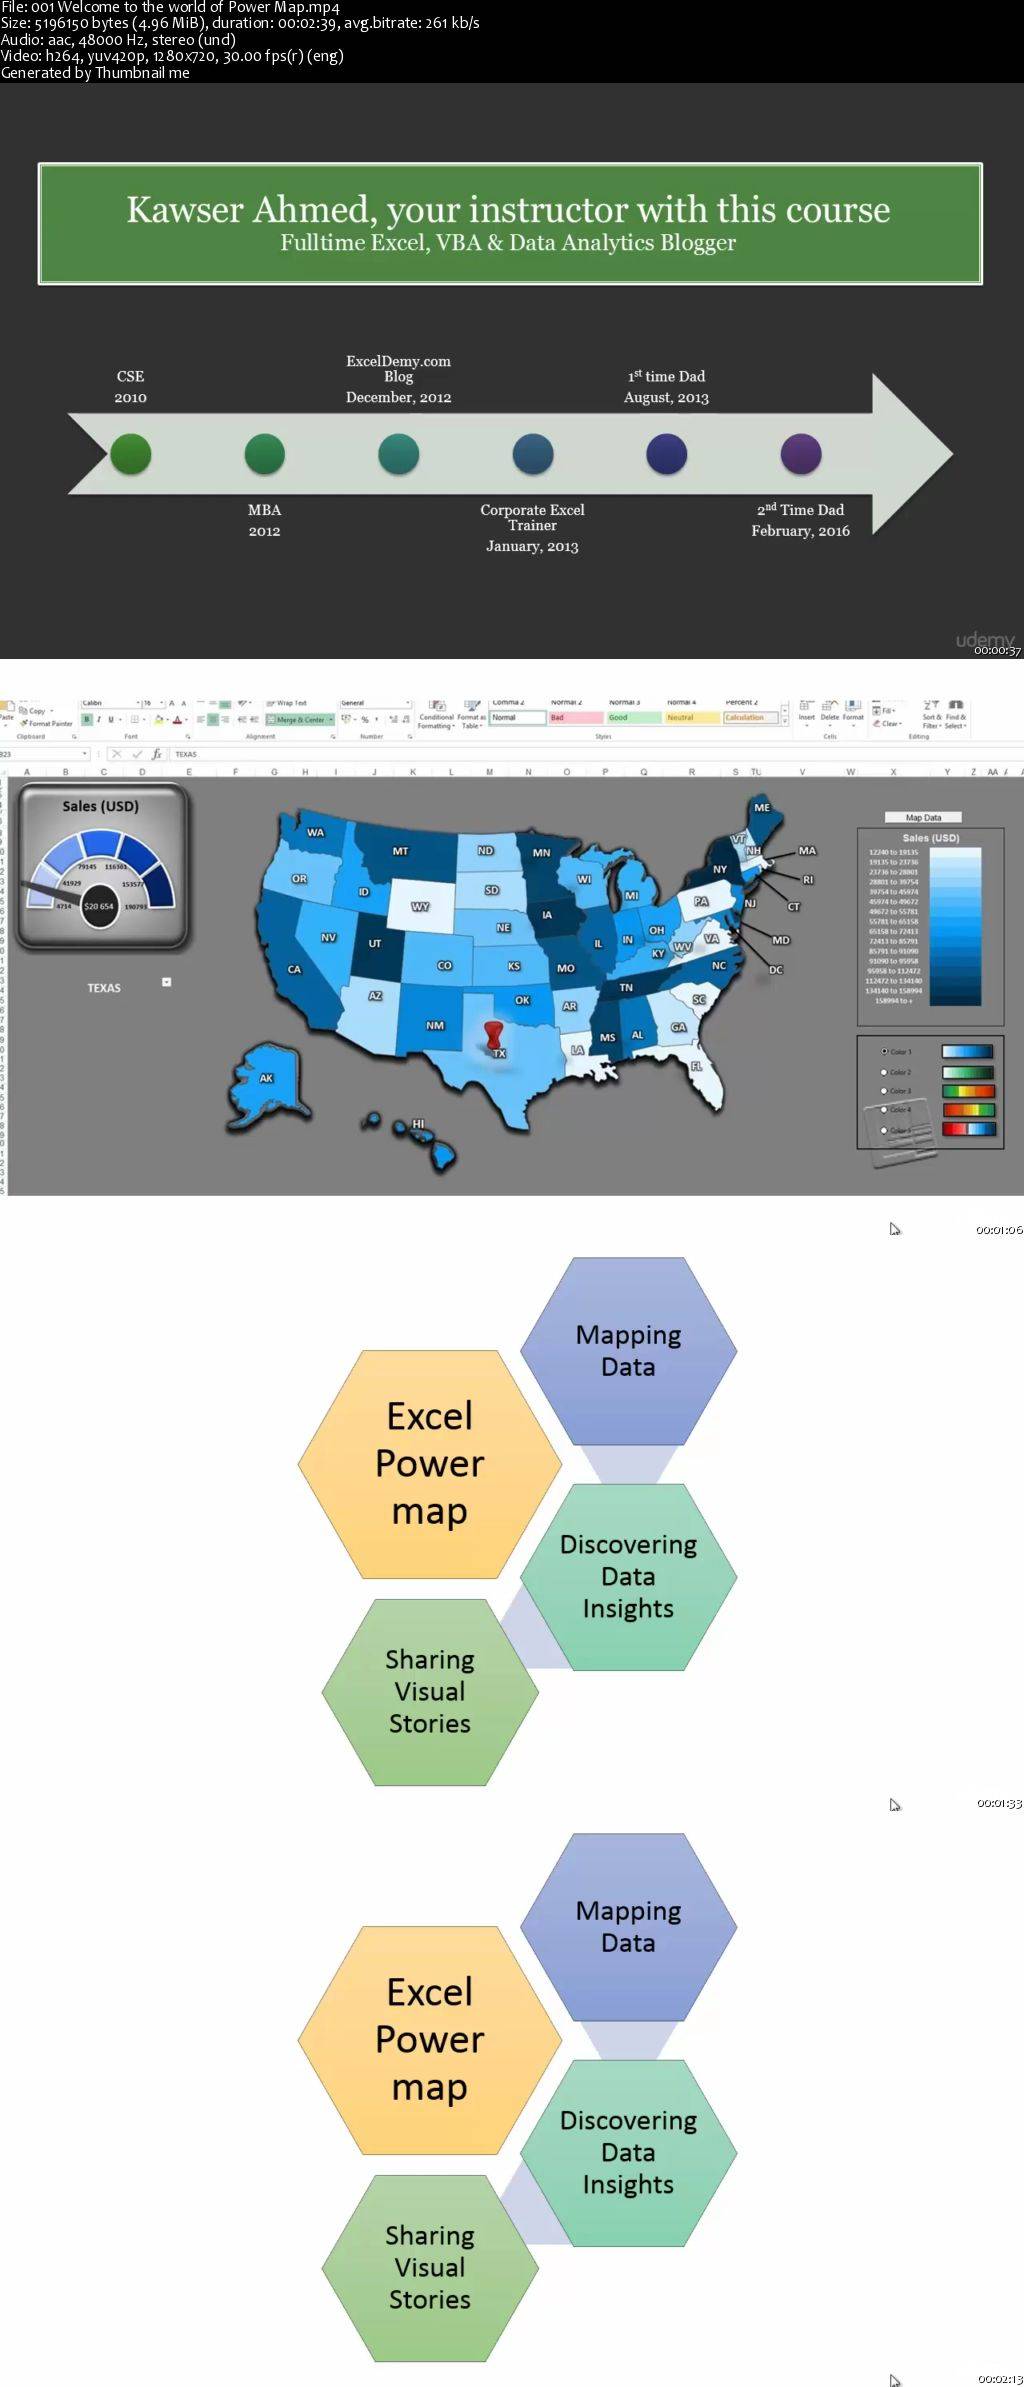
Welcome to my course on Microsoft Excel Power Map, a new mapping extension for Excel 2013 and Office 365, and is a part of the Excel Power BI extensions.
At the end of the course, you will be able to look at information in new ways using Excel’s 3-D data visualization tool, Power Map. A power map lets you discover insights you might not see in traditional 2-D tables and charts.
With this Excel Power Map course, you will learn to plot geographic and temporal data on a 3-D globe or custom map, show it over time, and create visual tours that you can share with other people.
What you will learn from this course:
Mapping data: You will be able to plot more than a million rows of data visually on Bing maps in 3-D format from an Excel table or Data Model in Excel.
Discovering data insights: you will gain new understandings by viewing your data in geographic space and seeing time-stamped data change over time.
Sharing visual stories: You will be able to capture screenshots and build cinematic, guided video tours that you can share broadly engaging audiences like never before. Or export tours to video and share them that way as well.
This course is designed for professionals who make reports and presentations in regular basis for their companies. Excel Power Map is an extremely powerful reporting tool. Sometimes we need to get sales reports and we want to identify regions and patterns of sales related to the customers. Acquiring working knowledge in Excel Power Map will take your reporting and presentations to a new high.
Thanks for your interest in my Excel Power Map course!
Excel Power Map A Power BI Tool for Reporting Professionals