Charts & Graphs from World's Top Presentations - Decoded!

Charts & Graphs from World's Top Presentations - Decoded!
MP4 | Video: AVC 1280x720 | Audio: AAC 44KHz 2ch | Duration: 2.5 Hours | 673 MB
Genre: eLearning | Language: English
MP4 | Video: AVC 1280x720 | Audio: AAC 44KHz 2ch | Duration: 2.5 Hours | 673 MB
Genre: eLearning | Language: English
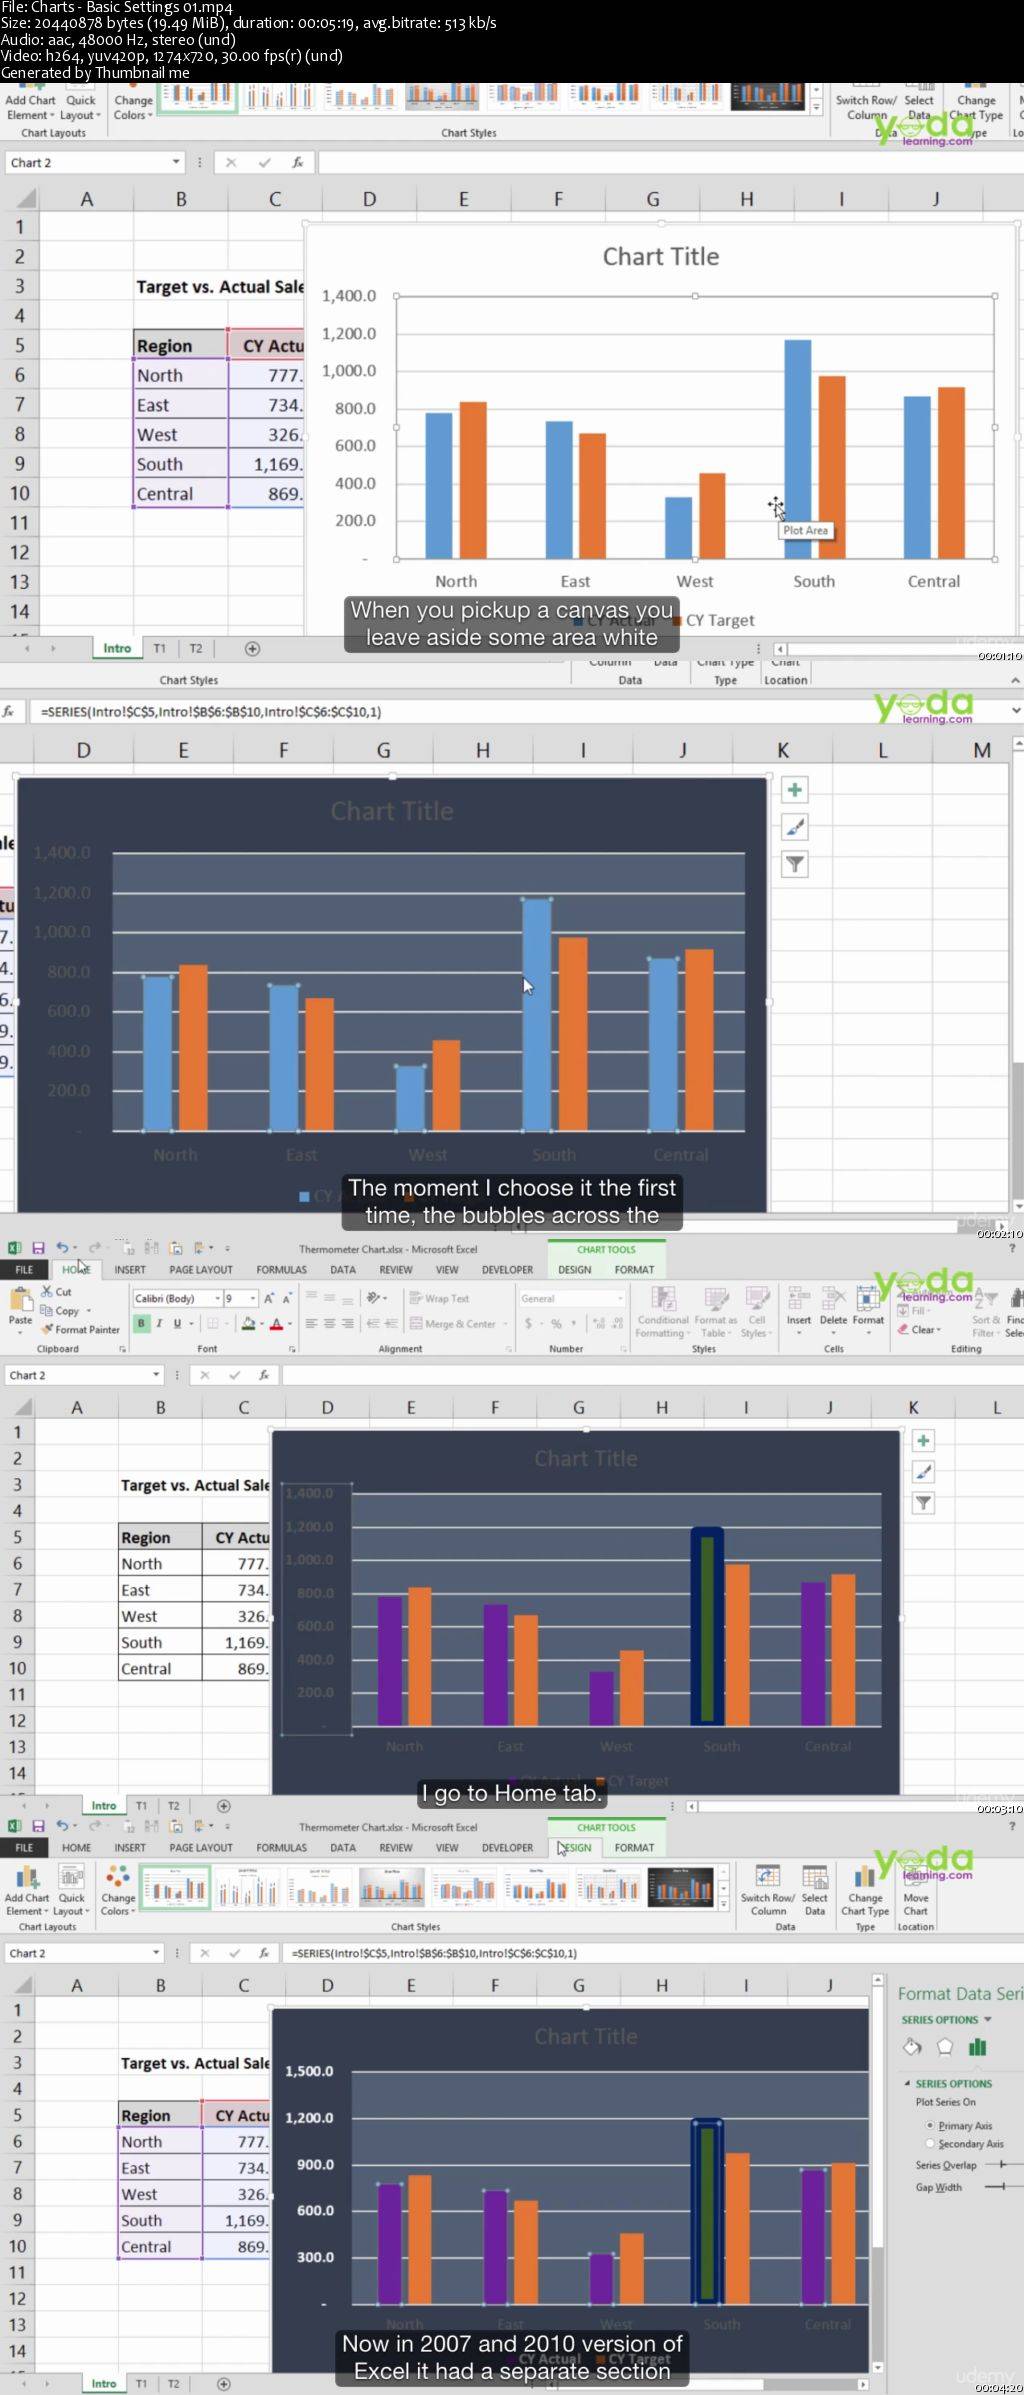
Basic to Advanced level Charts on Thermometer, 2Axis - Basics with Ghostlines, 100 percent stacked bar, Waterfall & more
Before you read what I have to say, see what my students are saying about my courses: on PowerPoint
"I would like to tell you that I am very impressed with your courses so far - I particularly like the short videos that allow me to get to a topic quickly and then move on (your competitors mostly offer 20-30 min videos which is a bit much to keep one's attention span). The other gem in your training are the shortcuts, I found no other course with the same insights." by Peter Klugsberger, Australia, ex-McKinsey & Co., served various senior roles (CEO, COO) in various companies
“Yes, for anyone who wants to exceeds the expectations set by himself / Seniors / peers. It is very important to convey the Right ideas in a right format through a right medium. Guns don't kill as much as Powerpoint bullets. The recollection of ideas through a well thought and presented ppt is high. PPT course is built on the "Best practices of Powerful powerpoint delivery". I made my mind to be a Subscriber of all of his courses after seeing his free videos which makes me think that I am actually in a real class and learning it by practising it. ” by Biswajeet Pattnaik , M&A Specialist (Finance and Petrochemical industry), SABIC , Saudi Arabia.
–––––––––––––––––––––––––––––––––––––––––––––––––––––––––-
PowerPoint Ninja Charts are taken from world's best presentation & brochures. Used by professional to make data easy to understand & Presentable. Below is the list of charts covered in the course:
Trendline Charts
Thermometer Charts
2 axis - Basics Charts with Ghostlines
Horizontal Bar Charts
100 Percent Stacked Bar Charts
Waterfall - as used by BMW
Combo Charts used by BHP Billiton
Stacked 100 column 80-20 Charts
Ringed Doughnut Charts
Radar Charts
Gantt Charts
Charts aesthetics 01 - 07
Chart_Lending Company
Tornado / Butterfly Charts
We have 25 videos of duration 2+ hrs. Through practical examples, they start from the foundation and take you to the Ninja level application.
Charts & Graphs from World's Top Presentations - Decoded!