


Modern Analytics with Microsoft Excel and Power BI
Modern Analytics with Microsoft Excel and Power BI
Duration: 6h 4m | .MP4 1280x720, 30 fps(r) | AAC, 44100 Hz, 2ch | 2.89 GB
Genre: eLearning | Language: English
Duration: 6h 4m | .MP4 1280x720, 30 fps(r) | AAC, 44100 Hz, 2ch | 2.89 GB
Genre: eLearning | Language: English
Learn how to design interactive and amazing Dashboards with Microsoft Excel and Power BI together.
What you'll learn:
How to connect and transform data in Power Query
How to model data and perform advanced calculations using DAX
How to analyze data using PivotTables and slicers
How to visualize data and build an interactive dashboard using Pivot charts and slicers
How to use Excel Data Models within Power BI
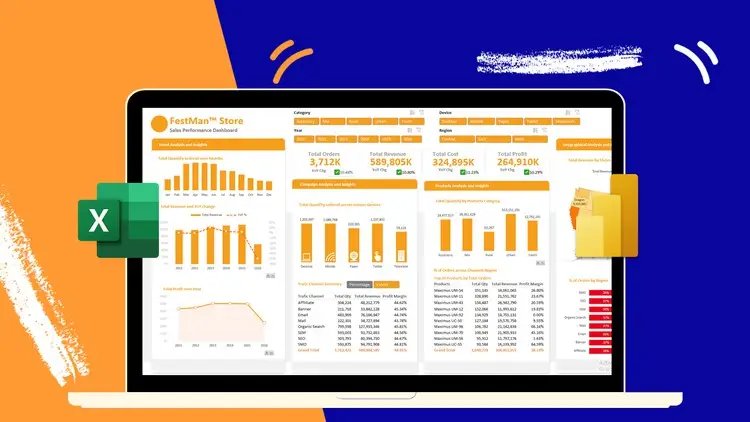
How to build an interactive dashboard in Microsoft Power BI
Requirements:
Background in Microsoft Excel is required.
Description:
Modern Analytics with Excel and Power BI
Learn how to build interactive and dynamic Dashboard using Modern Excel ( Power Query, PowerPivot, DAX and Power BI).
Microsoft Excel and Power BI have advanced analytical capabilities and BI tools which modern analysts can leverage to empower data conversations within their organizations.
In this course, you’ll gain awareness of the business intelligence landscape, technology capabilities, and their roles.
This course or Guided Project will be your ultimate guide to mastering the Advanced and Modern analytical capabilities in Microsoft Excel and Power BI.
This course covers how to connect and shape Data with Power Query, Data Modeling with PowerPivot and DAX, and Dashboard design with PivotTables, Pivot Charts, and Slicers.
You'll also learn how to utilize the Data Model we will build in Microsoft Excel to design an interactive Dashboard in Microsoft Power BI.
What you'll learn through this guided project:
How to connect and transform data in Power Query
How to model data and perform advanced calculations using DAX
How to analyze data using PivotTables and slicers
How to visualize data and build an interactive dashboard using Pivot charts and slicers
How to use Excel Data Models with Microsoft Power BI
How to build an interactive dashboard in Microsoft Power BI
Who this course is for:
Microsoft Excel users looking for ways to develop automate reports and dashboards
Microsoft Excel users who want to leverage their skills in Excel to learn Power BI
More Info