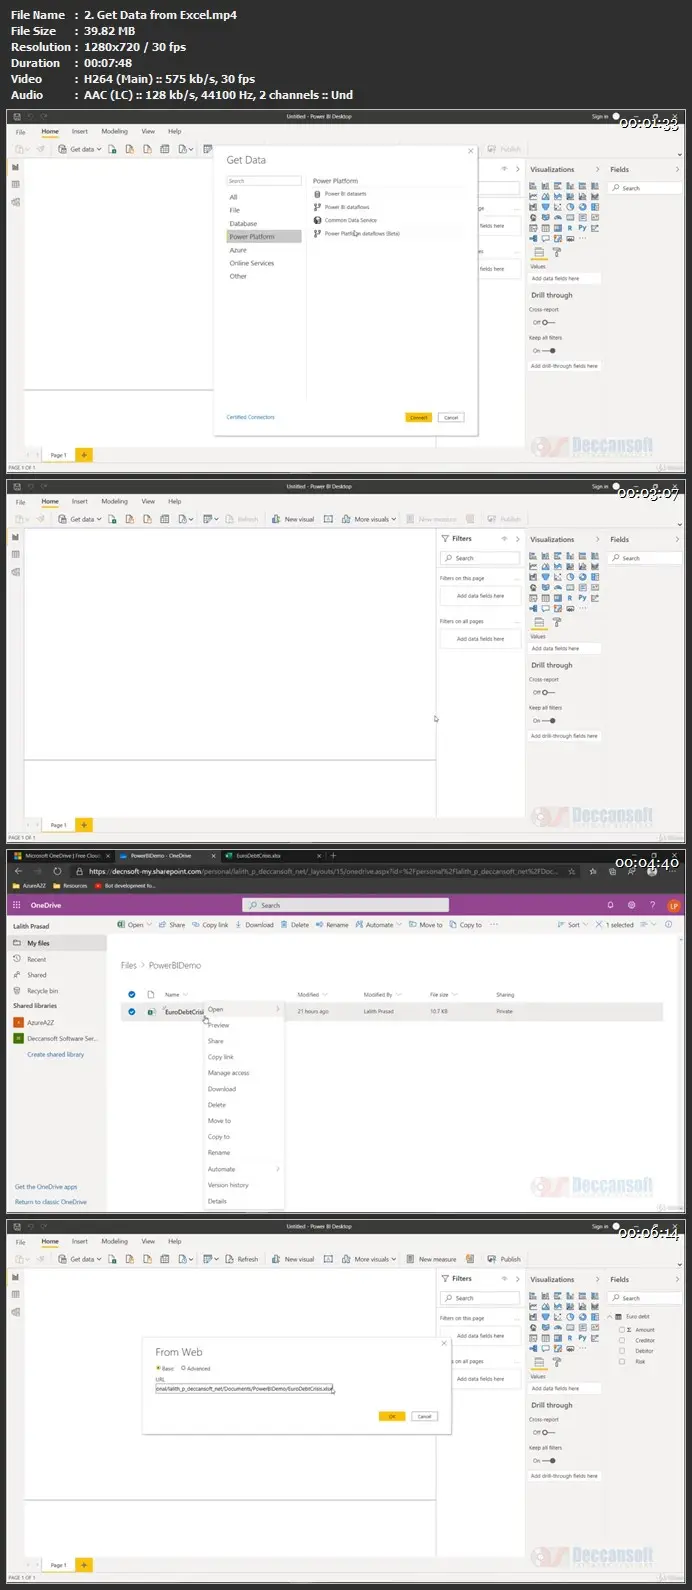
Microsoft Power BI: DA-100 Data Analytics using Power BI

Microsoft Power BI: DA-100 Data Analytics using Power BI
Duration: 12h 13m | .MP4 1280x720, 30 fps(r) | AAC, 44100 Hz, 2ch | 4.57 GB
Genre: eLearning | Language: English
Duration: 12h 13m | .MP4 1280x720, 30 fps(r) | AAC, 44100 Hz, 2ch | 4.57 GB
Genre: eLearning | Language: English
Transform, analyze & visualize data with the hottest analytical software in the market - Microsoft Power BI Desktop
What you'll learn
At the end of this course you will be able to analyze data from different data sources
Create your own datasets
Blend and transform raw data into beautiful interactive dashboards
Understand the business intelligence workflow from end-to-end
Build professional-quality business intelligence reports from the ground up
Identify the tasks that are performed by a Data Analyst
Understand the basics of data modeling
Understand DAX and use DAX for simple formulas and expressions.
Add basic report navigation and interactions
Create and configure a data source and dataset.
Requirements
Anyone who wants to enhance their knowledge of Data Analytics can take this course
Basic understanding of data analysis is a plus but not required
Experience with Microsoft Excel Pivot Charts and Pivot Tables would be beneficial.
Anyone who wants to take DA-100 Certification Exam can take this.
Description
If you're looking for hands-on training to learn Microsoft Power BI or take the DA-100 exam, this course is the right one for you.
In current times, where data is money, and there is an abundance of data everywhere, what we need are tools that actually analyze this data to draw reasonable and actionable conclusions. PowerBI is said to be a collection of software services and applications which work in sync to transform unrelated sources of data into actionable insights for the user. The data can be stored and used from excel sheets or can be used from a number of data warehouses, irrespective of being cloud-based or on-premise.
What's more, is that PowerBI allows you to not only analyze but also visualize the data in order to figure out the key components or insights required.
In this course, you will learn why Power BI offers you a comprehensive set of Business Intelligence tools for your data analysis goals and how to use these tools to fulfill all of the above tasks - and more.
Why learn PowerBI?
Easy to Use - PowerBI is very easy to use and so simple in creating visualizations to understand the data. It uses a drag and drop system in order to create visuals, as well as offers a choice of multiple chart types to match user preference. The interactive dashboard interface enables easy, quick, and simple usage.
Easy to Share - Once the reports are created in PowerBI, it is very easy to share them, both inside and outside your organization.
Easy to Understand - Users can make use of natural language to create reports and interact with the data when publishing it.
The name of it says it all! - PowerBI is said to be an incredibly powerful tool for both, modeling the data as well visualizing it. Since it uses the same base as Power Query, users are not required to learn a new language to handle the processing of this software.
It's being used everywhere - PowerBI is available on all platforms and this ensures that users can not only view but also make changes to reports from their mobile phones, tablets, or laptops. It is compatible with both forms of OS and as such is highly interactive.
Career in PowerBI
PowerBI experts and developers are in great demand in the market nowadays. The professionals are earning an industry average of $117,000 per annum. People can take up the role of analysts or PowerBI developers. The prerequisites for the latter are mentioned above.
What you’ll learn / Course Objective:
Identify the different roles in the data space
Identify the tasks that are performed by a Data Analyst
Describe the Power BI landscape of products and services
Understand the different connection methods and their performance implications
Apply data shape transformations
Understand the basics of data modeling
Define relationships and their cardinality
Implement Dimensions and hierarchies
Create histograms and rankings
Understand DAX and use DAX for simple formulas and expressions.
Work with Time Intelligence and Key Performance Indicators
Select and add appropriate visualization type
Add basic report navigation and interactions
Create and configure a data source and dataset.
Who this course is for:
People who never worked with Power BI and who want to understand how to use these tools
Anyone who is interested in learning how to connect the different Power BI tools with each other
People who want to understand how to create customized visuals with the Power BI Developer tools
More Info
Microsoft Power BI: DA-100 Data Analytics using Power BI