

Excel Data Analysis with Excel Pivot Tables, Excel Dashboard

Excel Data Analysis with Excel Pivot Tables, Excel Dashboard
.MP4 | Video: 1280x720, 30 fps(r) | Audio: AAC, 48000 Hz, 2ch | 2.68 GB
Duration: 5 hours | Genre: eLearning | Language: English
.MP4 | Video: 1280x720, 30 fps(r) | Audio: AAC, 48000 Hz, 2ch | 2.68 GB
Duration: 5 hours | Genre: eLearning | Language: English
Learn Excel Data Analysis & Excel Data Visualization with Excel Pivot Tables, Formulas, Pivot Charts & Excel Dashboards.
What you'll learn
You will learn about Pivot Tables and Pivot Chart
You will learn 30 Plus top Microsoft Excel Formulas and Functions
You will learn how to use 20 Plus different Excel Charts and Graphs used in Dynamic Excel Dashboards.
You will learn how to Design, Format and Style Data Elements
Requirements
This Course is created on Excel 2016, You can also use Excel 2010 and above
Basic Excel Knowledge
Interest to Learn and Upgrade Your Skillset
A Windows or a MAC PC where Microsoft Excel is Installed
Description
Microsoft Excel - Excel Data Analysis and Excel Data Visualization with Excel Pivot Tables, Excel Pivot Charts and Interactive Excel Dashboards.
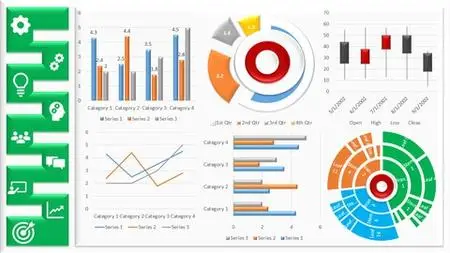
Excel Charts and Excel Graphs are one of most powerful features of Microsoft Excel which allows the users to represent numerical data in Graphical Data Visualization format so that end user gets a better view of the Information discussed.
In this course
You will learn the Excel Pivot Table and Excel Pivot Chart Function in detail and you will learn how to create Dynamic Excel Charts and Excel Graphs.
We will help you understand how to present your data Graphically on a Dynamic Chart, Graph or 3D Map, to make the information appear in a simplified manner.
You will learn the Top functions and Top formulas used to Pivot your data.
You will Learn to create a Dynamic Sales Dashboard
You will learn how to design, style and format aspects of Excel 2016 are applied on charts, graphs and 3D maps.
You will use the dynamic graphical representation to display your complex data in an impressive way.
Learn to customize Layout, Axes, Grid lines, Spark lines, Trend lines and Error Bars.
This Course is structured in 8 Plus chapters and you will learn all the aspects of Pivot Function in depth .
We will go through, 20 Plus different Chart types used in Dynamic Excel Dashboards , Top formulas and Top Functions, Design and Style Elements and finally you will create a Dynamic Excel Sales Dashboard.
So Lets the Show begin!
Who is the target audience?
If you are looking to improve your Microsoft Excel Skills
If you want to learn how to create Excel Charts, Formulas and Functions and Excel Shortcuts
If you want to learn foundation of how to create Excel Dynamic Dashboards
If you create Management Reports or MIS
Excel users who have basic skills but would like to become more proficient in data exploration and analysis
Anyone who works with Excel on a regular basis
Excel Data Analysis with Excel Pivot Tables, Excel Dashboard
