


Lynda - Windows Performance Tools: Memory Leak Analysis with Intel Inspector

Lynda - Windows Performance Tools: Memory Leak Analysis with Intel Inspector
Size: 3.88 GB | Duration: 0h 42m | Video: AVC (.mp4) 1280x720 30fps | Audio: AAC 48KHz 2ch
Genre: eLearning | Level: Intermediate | Language: English
Size: 3.88 GB | Duration: 0h 42m | Video: AVC (.mp4) 1280x720 30fps | Audio: AAC 48KHz 2ch
Genre: eLearning | Level: Intermediate | Language: English
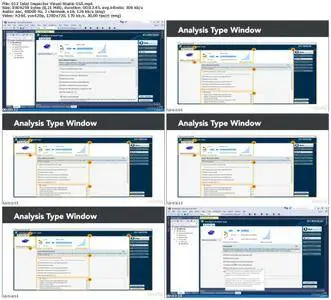
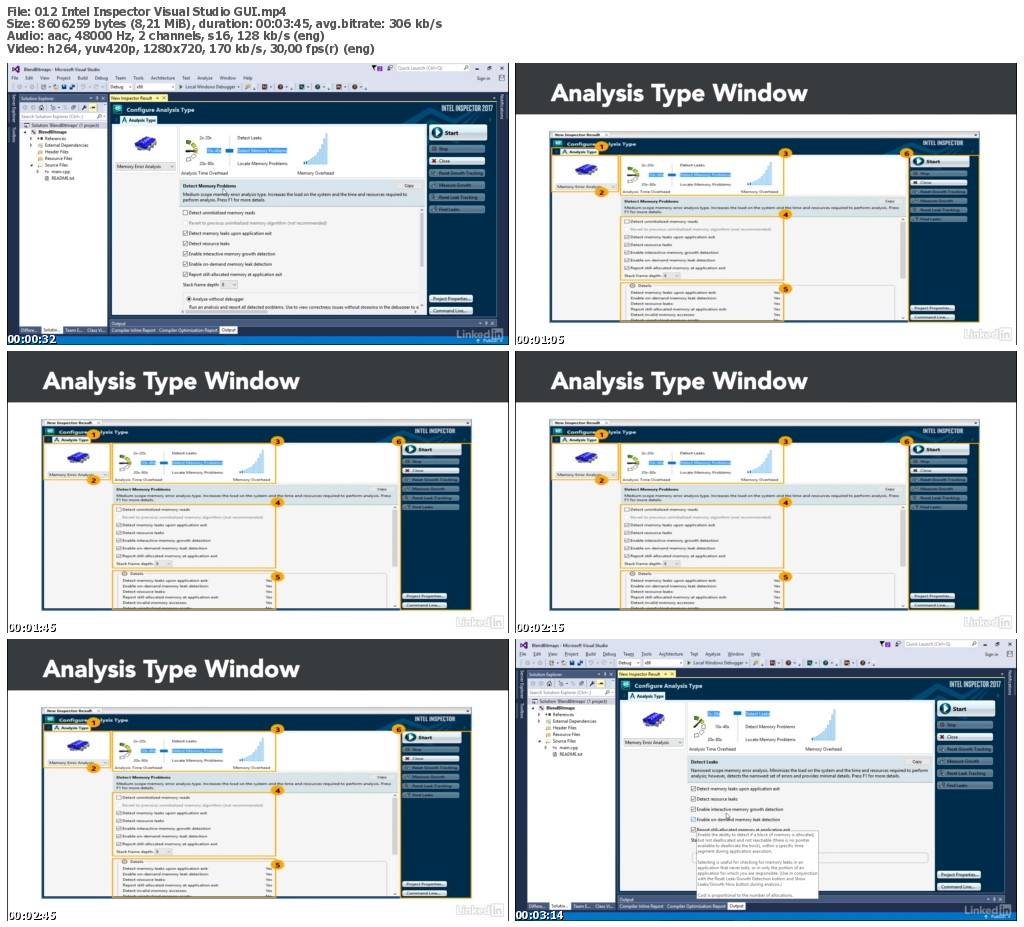
Memory leaks are a common cause of unexpected crashes in Windows applications. It's important to detect them before your apps go live. Luckily, there is a tool to help. Intel Inspector XE is a memory and threading debugger that can be used to detect memory leaks in C, C++, and Fortran applications running on Windows. Learn to use the Intel Inspector to easily find and repair memory leaks in any of your own Windows applications, with this installment of Windows Performance Tools. Thomas Pantels shows how to profile a C++ application, detect memory issues with Inspector XE, and pinpoint memory leaks in an OpenCV demo app. By the end of this course, you will be able to use the Intel Inspector to easily find memory-related issues like memory leaks in any of your own applications.
* Installing Intel Inspector XE
* Setting up OpenCV
* Detecting memory leaks
* Visualizing memory usage growth
* Conducting memory leak analysis
* Fixing memory leaks in source code
* Setting up OpenCV
* Detecting memory leaks
* Visualizing memory usage growth
* Conducting memory leak analysis
* Fixing memory leaks in source code
Lynda - Windows Performance Tools: Memory Leak Analysis with Intel Inspector
No mirrors below please.