

Lynda - Visualizing Geospatial Data with Power Map
Lynda - Visualizing Geospatial Data with Power Map
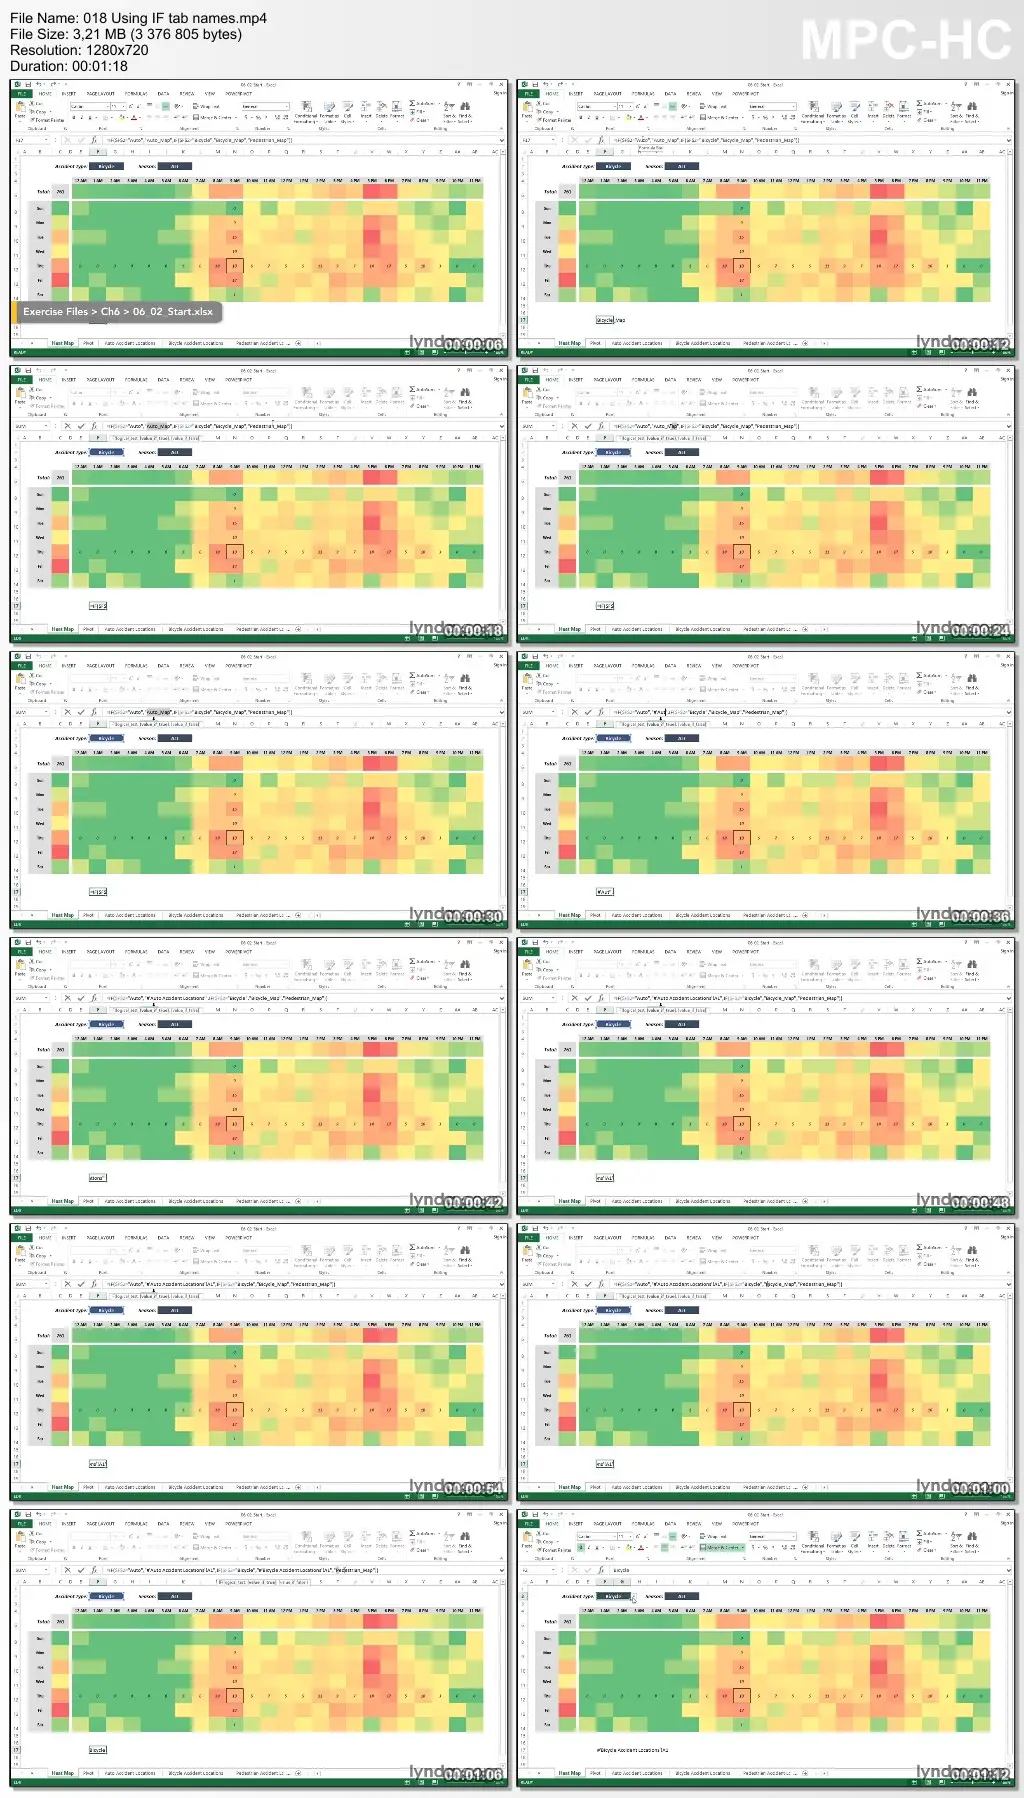
Size: 199MB | Duration: 0h 37m | Video: AVC (.mp4) 1280x720 15&30fps | Audio: AAC 48KHz 2ch
Genre: eLearning | Level: Intermediate | Language: English
Size: 199MB | Duration: 0h 37m | Video: AVC (.mp4) 1280x720 15&30fps | Audio: AAC 48KHz 2ch
Genre: eLearning | Level: Intermediate | Language: English
Take your data analysis skills (and your data visualizations) to the next level with Power Map, Excel's tool for exploring map and time-based data in 3D. This course takes the project you created in Excel Workshop: Building a Dynamic Heat Map and shows how to reconstruct the visualization using Power Map. First you'll learn how to prepare and standardize your data, using IF and CONCATENATE to combine fields. Then find out how to add a PivotTable to create a new or supplementary data source. Then you will get right down to it and build a Power Map image to visualize geospatial data: accidents in different seasons and locations. In the final chapters, author Chris Dutton provides two options for linking data to the map images, using the INDIRECT and HYPERLINK functions.
* Reviewing the dataset
* Standardizing location data
* Creating a new data source in a PivotTable
* Creating new Power Map images
* Populating Power Map images with INDIRECT
* Linking to map images with HYPERLINK
* Standardizing location data
* Creating a new data source in a PivotTable
* Creating new Power Map images
* Populating Power Map images with INDIRECT
* Linking to map images with HYPERLINK
Lynda - Visualizing Geospatial Data with Power Map
No mirrors below please.