JMP Training for Statistics & Data Visualization
JMP Training for Statistics & Data Visualization
Video: .mp4 (1280x720, 30 fps(r)) | Audio: aac, 48000 Hz, 2ch | Size: 2.12 GB
Genre: eLearning Video | Duration: 47 lectures (3 hour, 22 mins) | Language: English
Learn Statistics, Analytics & Data Visualization with JMP Statistical Software
Video: .mp4 (1280x720, 30 fps(r)) | Audio: aac, 48000 Hz, 2ch | Size: 2.12 GB
Genre: eLearning Video | Duration: 47 lectures (3 hour, 22 mins) | Language: English
Learn Statistics, Analytics & Data Visualization with JMP Statistical Software
What you'll learn
Statistics
JMP Software
Data Visualization
Data Analytics
Hypothesis Testing
Analysis of Variance
Linear Regression
Distributions
Control Charts
Heat Maps
Descriptive Statistics
Inferential Statistics
Pareto Charts
Lean Six Sigma
Requirements
Basic knowledge of computers
Description
Learn Statistics, Analytics and Data Visualization with JMP 15 to solve problems, reveal opportunities and inform decisions. Create opportunities for you or key decision-makers to discover data patterns such as customer purchase behavior, sales trends, quality defects, or production bottlenecks.
What You'll Learn:
Here is a summary of topics covered in this course:
Hypothesis Testing
Normal Distributions
Shapiro Wilk Test
Z Test & T Test
2 Sample T Test
ANOVA
One Way ANOVA
T Test & Tukey Test
Data Visualization
Descriptive Statistics
Quality Control Charts (Pareto, X Bar & R, & IMR)
Distributions
Linear Regression
Fit Y by X
(Pearsons) Correlation Coefficient
Data Clean Up
Publish sharable Analysis & Dashboards
Section 2: Data Types, Column, Data Clean Up
Import data from a variety of sources: Excel, Google Sheets, CSV, etc. Learn how to format specific columns and how to clean data before creating graphs / distributions / analysis.
Section 3: JMP Visuals & Graphing
Learn how to create individual value plots (scatter plots), bar charts, pie charts, parallel plots, heat maps, and more.
Section 4: Descriptive Statistics & Quality Control Charts
Learn and create tables of descriptive statistics on JMP. Create control charts such as Pareto Charts, X Bar & R Charts and IMR Charts.
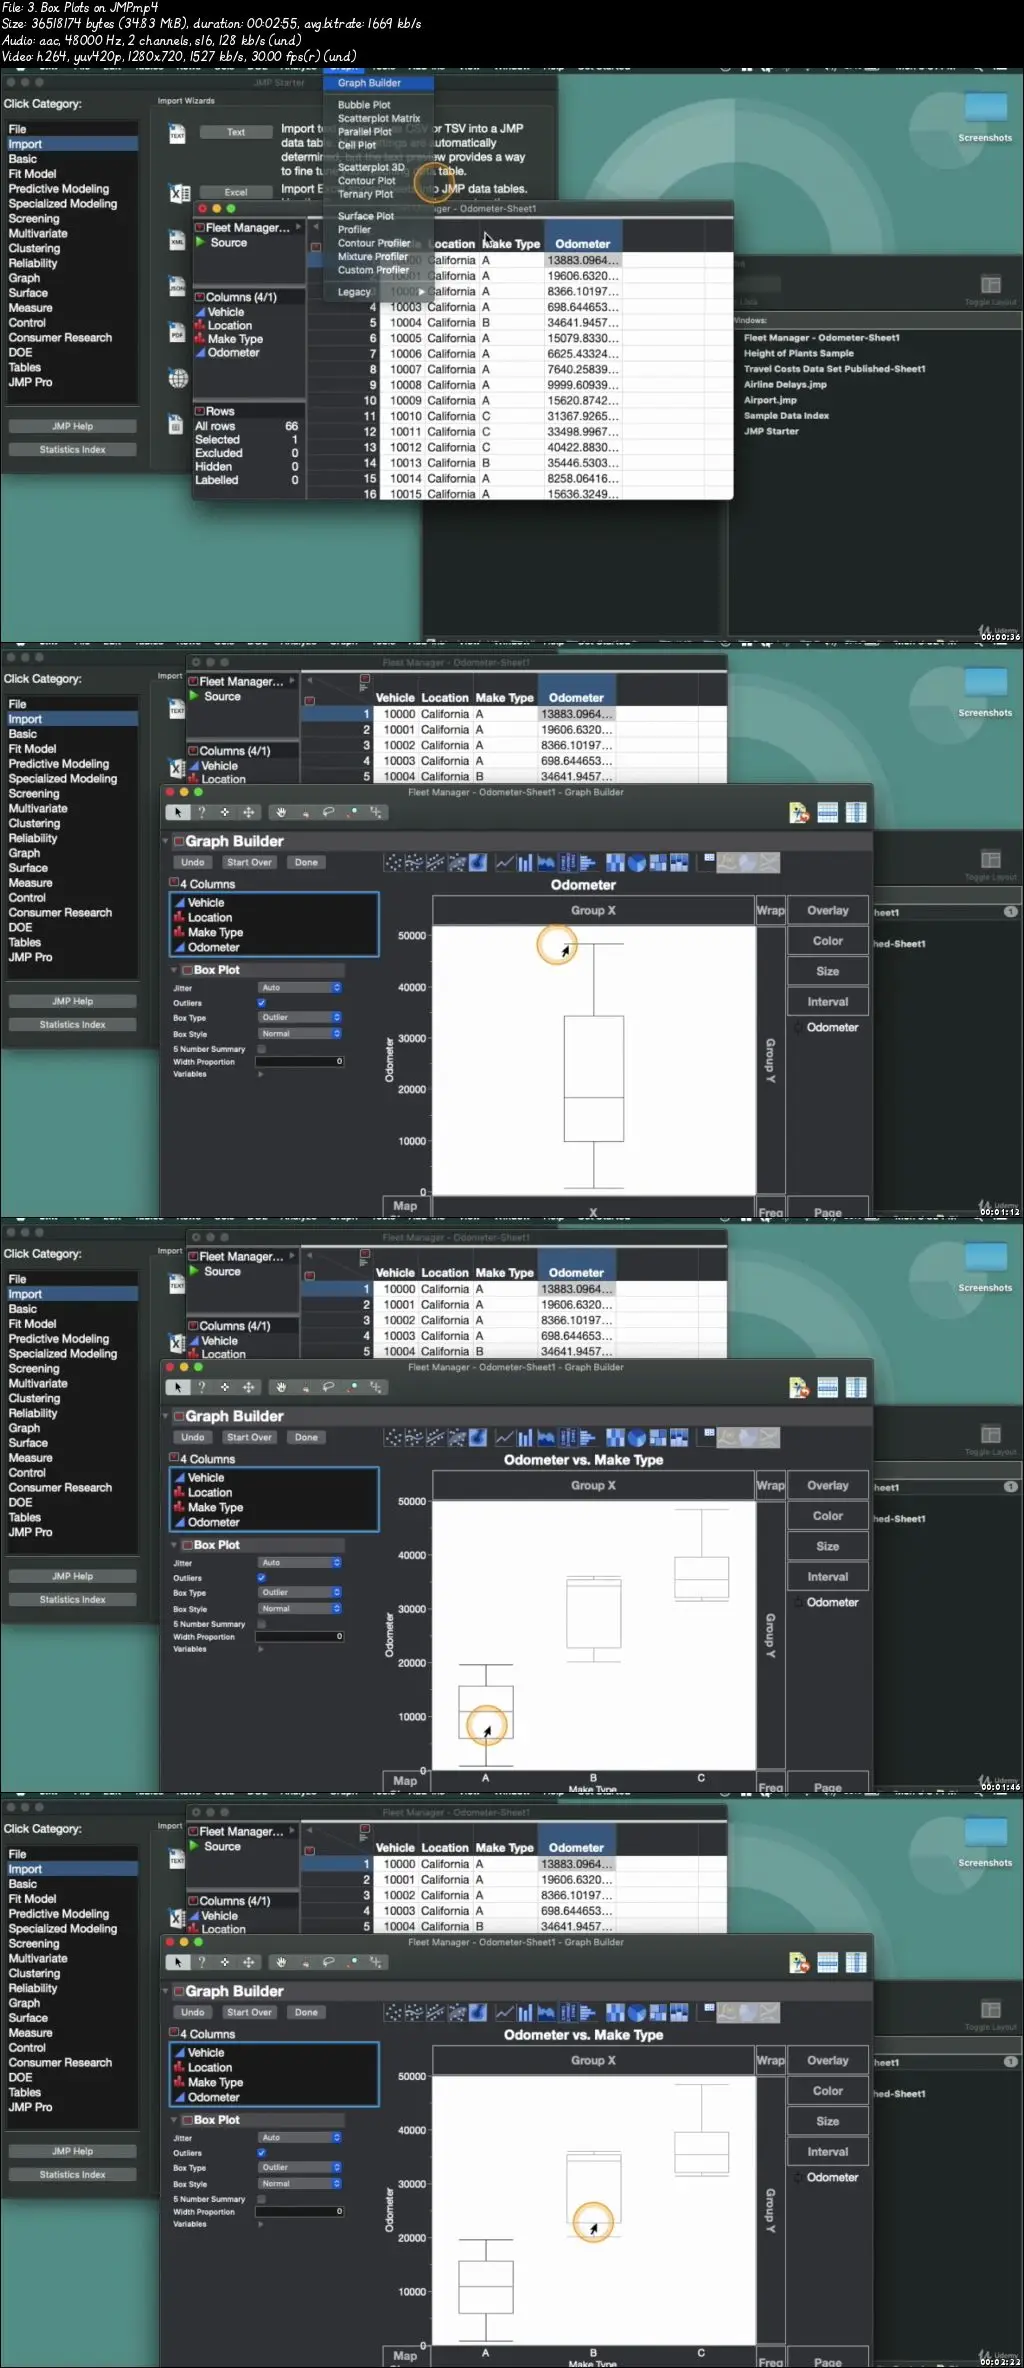
Section 5: Distributions Overview
Learn about Box Plots and Histograms in detail. Then learn how to create distributions and what analysis you can take from it.
Section 6: Publish Dashboards
Post your finished analysis to the web in dashboard form to share with others. Save and automate reports for changing data.
Section 7: Linear Regression (Fit Y by X):
Learn about linear regression and dependent and independent variables. Learn how correlation coefficient can help you analyze future trends of big data. Create your own fitted lines on JMP using Fit Y by X tool.
Section 8: Hypothesis Testing:
Learn an introduction to hypothesis testing and what it means. Learn the assumptions for hypothesis testing. Understand confidence intervals and significance (alphas). Learn how to test to see if your data comes from a normally distributed population using the Shapiro Wilk Test. Learn Z Test and T Test through visual explanation and through JMP. Learn 2 Sample T Test.
Section 9: ANOVA
Dive into analysis of variance (ANOVA) and understand the basics. Learn how to perform a one way ANOVA test on multiple examples. Expand your knowledge through learning how to perform ANOVA T Tests & Tukey tests.
Are there any course requirements or prerequisites?
Willingness to learn
A part of this course on the use of JMP 15. You will need to have the software to practice. Please note that you can download 30 days trial version of this software from JMP's website.
Who this course is for:
You should take this course if want to learn JMP completely from scratch
You should take this course if you know some JMP skills but want to get better
You should take this course if you are good with JMP and want to take your skills to the next level and truly leverage the full potential of JMP
Who this course is for:
Beginner users interested in statistics software
JMP Users
Staticians
Engineers
Scientists
Data users
JMP Training for Statistics & Data Visualization