Introduction to Tables and Pivot Tables in Excel

Introduction to Tables and Pivot Tables in Excel
.MP4, AVC, 1280x720, 30 fps | English, AAC, 2 Ch | 1h 4m | 2.18 GB
Instructor: Ben Scholl
.MP4, AVC, 1280x720, 30 fps | English, AAC, 2 Ch | 1h 4m | 2.18 GB
Instructor: Ben Scholl
Learn to organize, analyze, and summarize data efficiently using Excel Tables and Pivot Tables.
What you'll learn
- Learn to sort table data using simple and partial field sorting techniques.
- Use the SORT and SORTBY functions to organize data dynamically in arrays.
- Filter table data using basic and complex criteria for precise results.
- Apply the FILTER function to extract specific data sets from tables.
- Use the UNIQUE function to find distinct values within data tables.
- Reference tables in formulas to simplify calculations and improve accuracy.
- Analyze data with DAVERAGE and DGET to perform database-style queries.
- Perform statistical analysis using case studies on real defect databases.
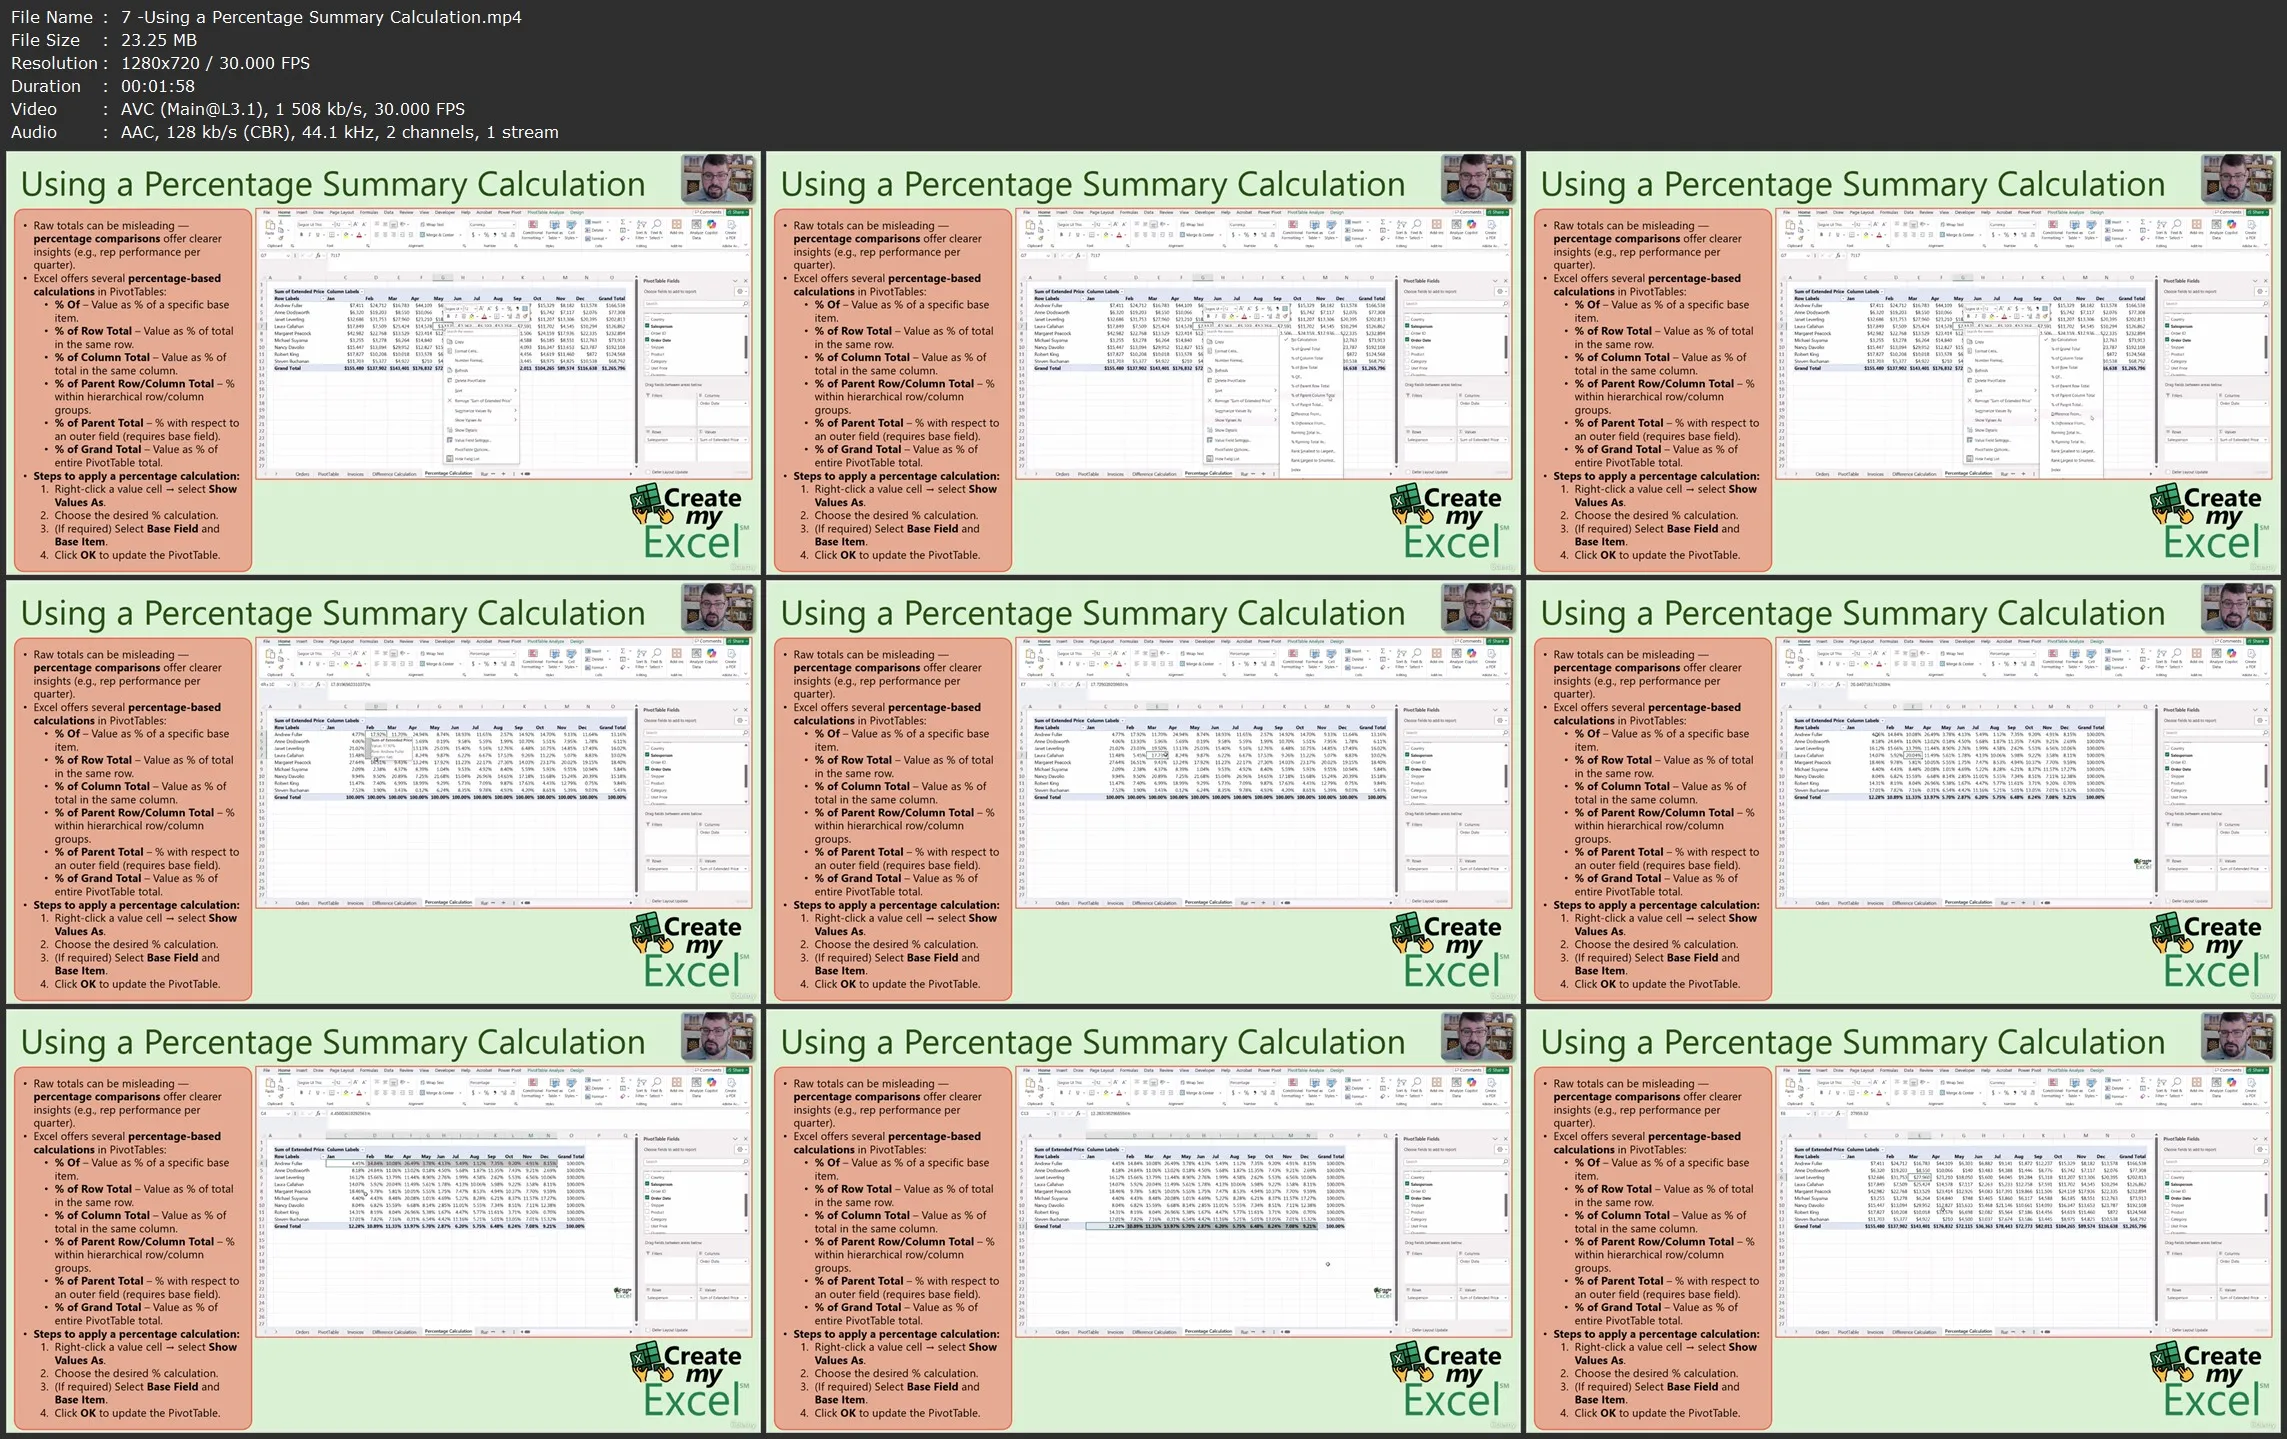
- Create and customize PivotTables for advanced data summarization.
- Use calculated fields and items in PivotTables to enhance data insights.
Requirements
- Microsoft Excel (Office 2021 or Microsoft 365) installed.
- Basic knowledge of Excel (e.g., entering data, simple calculations).
- Access to a computer with a stable internet connection.
- No prior advanced Excel skills required; suitable for beginners.
Description
This comprehensive Excel course is designed to empower learners with advanced skills in data analysis, focusing on the powerful capabilities of tables and PivotTables. Participants will develop a strong foundation in organizing and managing large datasets efficiently, enabling them to sort and filter data in a variety of ways to reveal important patterns and insights. By mastering the creation and manipulation of Excel tables, students will learn to sort data by partial fields, ignore common articles during sorting, and apply custom sorting criteria that enhance data clarity and usability.
The course dives deep into dynamic array functions such as SORT, SORTBY, FILTER, and UNIQUE, which allow users to automate complex data operations and streamline workflows. These functions empower students to create flexible, dynamic reports that update automatically as data changes. Additionally, learners will understand how to reference tables within formulas to simplify calculations and ensure accuracy.
Beyond tables, the course emphasizes the importance of PivotTables as a tool for summarizing and analyzing data quickly and effectively. Students will gain hands-on experience customizing PivotTables by hiding subtotals and grand totals, changing summary calculations to include differences, percentages, running totals, and index values. They will also learn to create calculated fields and items to extend PivotTable functionality and integrate PivotTable results seamlessly into worksheet formulas for advanced reporting.
Throughout the course, practical exercises and real-world case studies provide opportunities to apply these techniques in meaningful ways, equipping learners with the confidence to handle complex data sets and generate actionable business insights. This course is ideal for professionals, analysts, and anyone looking to elevate their Excel skills for data-driven decision-making and efficient reporting in today’s data-centric workplaces.
Who this course is for:
- This course is for Excel beginners eager to learn data analysis basics.
- Ideal for business professionals wanting to improve spreadsheet skills.
- Perfect for analysts needing advanced sorting and filtering techniques.
- Great for students preparing for careers involving data management.
- Suited for office workers who handle large data sets regularly.
- Helpful for managers who want to create insightful reports with PivotTables.
- Useful for accountants needing to organize and analyze financial data.
- Designed for anyone aiming to automate data tasks using Excel functions.
- Suitable for data enthusiasts looking to deepen their Excel knowledge.
- Also for professionals who want to streamline data analysis and reporting. Ask ChatGPT
Introduction to Tables and Pivot Tables in Excel