


Introduction to Data Visualization for Data Analysts

Introduction to Data Visualization for Data Analysts
.MP4, AVC, 1280x720, 30 fps | English, AAC, 2 Ch | 32m | 105 MB
Instructor: Ben Howard
.MP4, AVC, 1280x720, 30 fps | English, AAC, 2 Ch | 32m | 105 MB
Instructor: Ben Howard
Data is everywhere, but seeing it differently unlocks insights. This course teaches you to transform raw data into clear visualizations, solving real-world problems with Excel, Power BI, and Tableau, thereby making data clear and accessible for all.
What you'll learn
Data is the new gold—no doubt about it. But how do you mine to find it?
In this course, Introduction to Data Visualization for Data Analysts, you’ll learn how to create high-impact, high-quality data visualizations that effectively find and expose golden nuggets hidden in data.
First, you’ll explore the fundamentals of data visualization, including its definition and the key components of compelling visual representations.
Next, you’ll dive into the data visualization workflow, gaining the skills to transform raw data into meaningful visual stories.
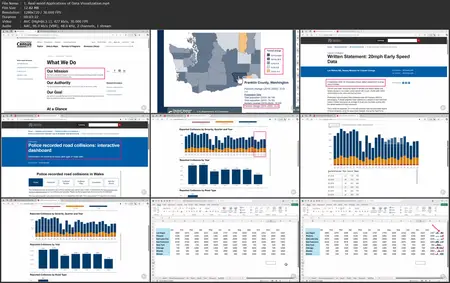
Finally, you'll discover how data visualizations can solve real-world problems using industry-standard tools like Excel, Power BI, and Tableau.
When you’re finished with this course, you'll have the expertise to present complex data in a clear, visually engaging way, making it accessible to non-technical audiences.
Introduction to Data Visualization for Data Analysts
