Interactive Data visualization in D3.Js For Beginners

Interactive Data visualization in D3.Js For Beginners
Video: .mp4 (1280x720, 30 fps(r)) | Audio: aac, 44100 Hz, 2ch | Size: 0.98 GB
Genre: eLearning Video | Duration: 10 lectures (1 hour, 55 mins) | Language: English
Discover How To Design and build beautiful data visualizations with d3.js.
Video: .mp4 (1280x720, 30 fps(r)) | Audio: aac, 44100 Hz, 2ch | Size: 0.98 GB
Genre: eLearning Video | Duration: 10 lectures (1 hour, 55 mins) | Language: English
Discover How To Design and build beautiful data visualizations with d3.js.
What you'll learn
Understand the fundamental building blocks of D3
Create data-driven visualizations (graphs, charts, diagrams) with D3 JS
Master advanced tools in D3, building choropleth maps, brushes, tooltips, and layouts
How to use D3 Scales
How to use D3 Axes
Animation in D3
Interactivity in D3
And many more..
Requirements
A basic to moderate level of JavaScript
A basic to moderate level of HTML
Students should know how to interact with the Document Object Model (DOM) using jQuery
Description
D3.js has become the standard for creating custom interactive data visualizations for the web. This feature-rich open source javascript library allows you to create dynamic and extremely diverse experiences that can interact with users and any other element on a web page.
For programmers familiar with Javascript, it is not hard to pick up and run with D3 very quickly. For those with limited javascript experience, it can be intimidating. This course will help anyone who has some javascript familiarity get comfortable creating rich, animated, interactive experiences with D3. If you have worked with jQuery, for instance, you can easily work with D3.
Who this course is for:
Anyone who has a passion for working with data
Anyone who wants to build complex interactive websites with D3js
Developers wanting to build data-driven UI diagrams with JavaScript
Developers wanting to learn about data visualization
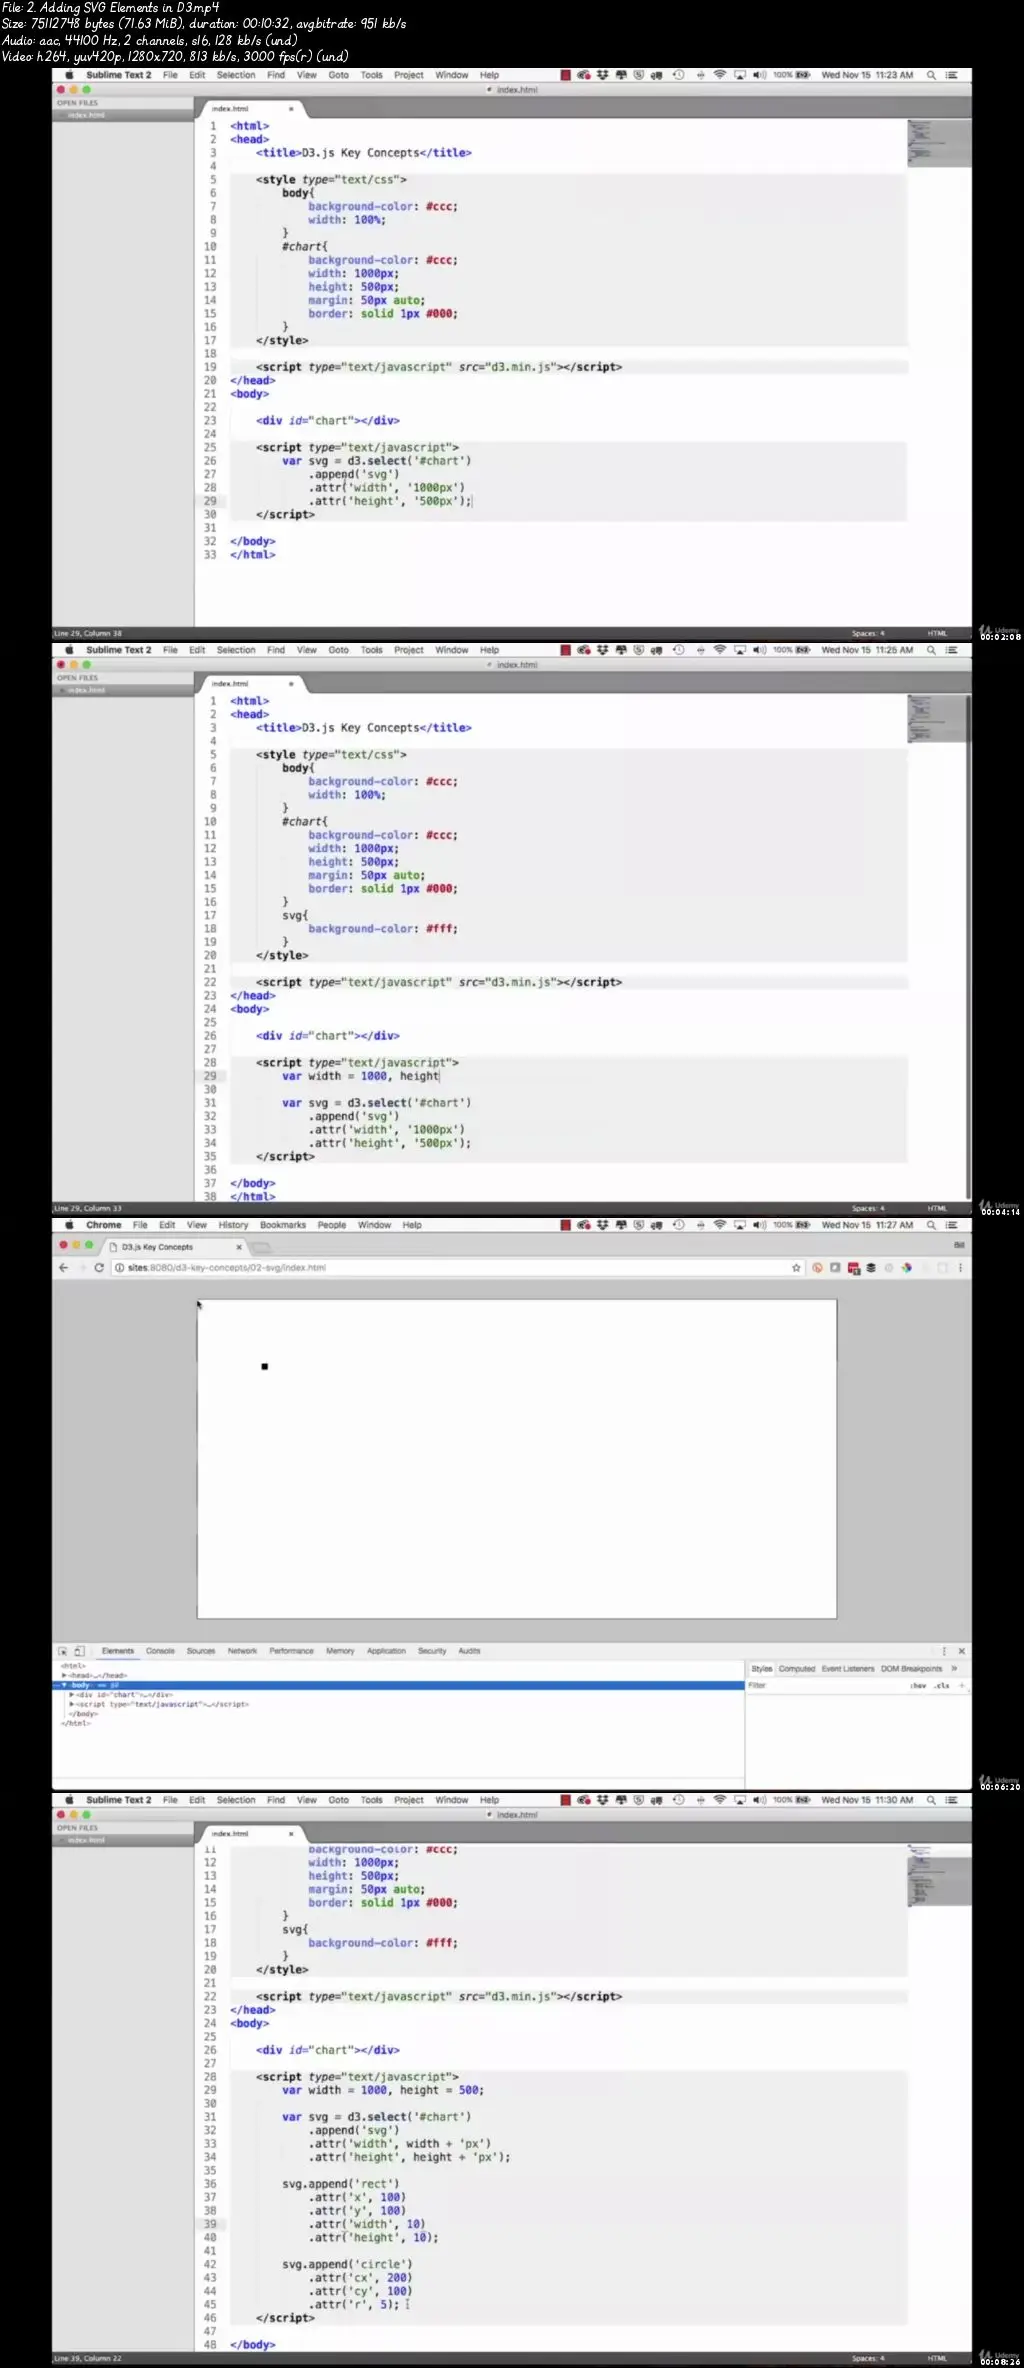
Developers wanting to create SVG diagrams with d3
Interactive Data visualization in D3.Js For Beginners