Instrumenting Applications with Metrics for Prometheus

Instrumenting Applications with Metrics for Prometheus
.MP4, AVC, 1280x720, 30 fps | English, AAC, 2 Ch | 2h 3m | 351 MB
Instructor: Elton Stoneman
.MP4, AVC, 1280x720, 30 fps | English, AAC, 2 Ch | 2h 3m | 351 MB
Instructor: Elton Stoneman
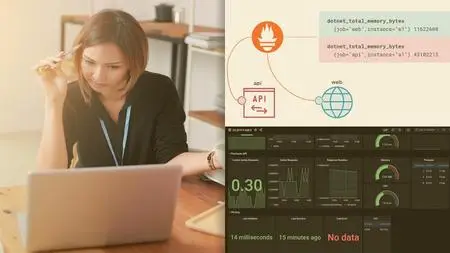
Instrumentation tells you what's going on inside your apps, helping you to see if they're healthy and to track down any problems. This course will teach you how to add metrics to your own apps so you can monitor them with Prometheus and Grafana.
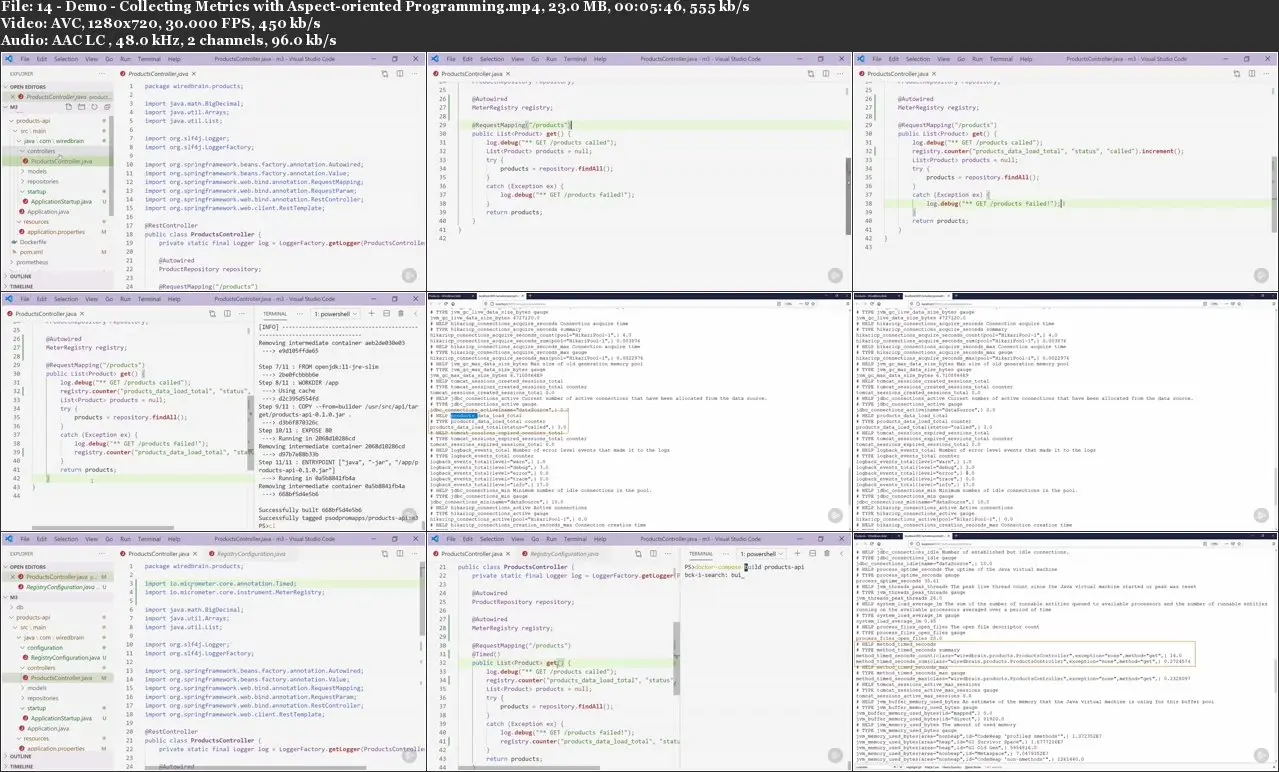
Applications need to provide a metrics API for Prometheus to read, which contains data on how hard the app is working and what it's actually doing. In this course, Instrumenting Applications with Metrics for Prometheus, you'll learn how to set that up in four major languages - Java, Go, Node.js, and .NET.
First, you'll see how easy it is to add Prometheus support using a client library. Next, you'll learn how to record the custom metrics that are relevant to your apps. Then, you'll see how to integrate monitoring with batch processing jobs. Finally, you'll learn how to collect metrics in Prometheus from distributed components and view them in a Grafana dashboard.
When you're finished with the course, you’ll have the skills and knowledge to add monitoring to your own applications.
Instrumenting Applications with Metrics for Prometheus