Hands-On Data Science: 2 Sales Dashboard with Tableau

Hands-On Data Science: 2 Sales Dashboard with Tableau
.MKV, AVC, 1280x720, 30 fps | English, AAC, 2 Ch | 1h 1m | 696 MB
Instructor: Ben Sullins
.MKV, AVC, 1280x720, 30 fps | English, AAC, 2 Ch | 1h 1m | 696 MB
Instructor: Ben Sullins
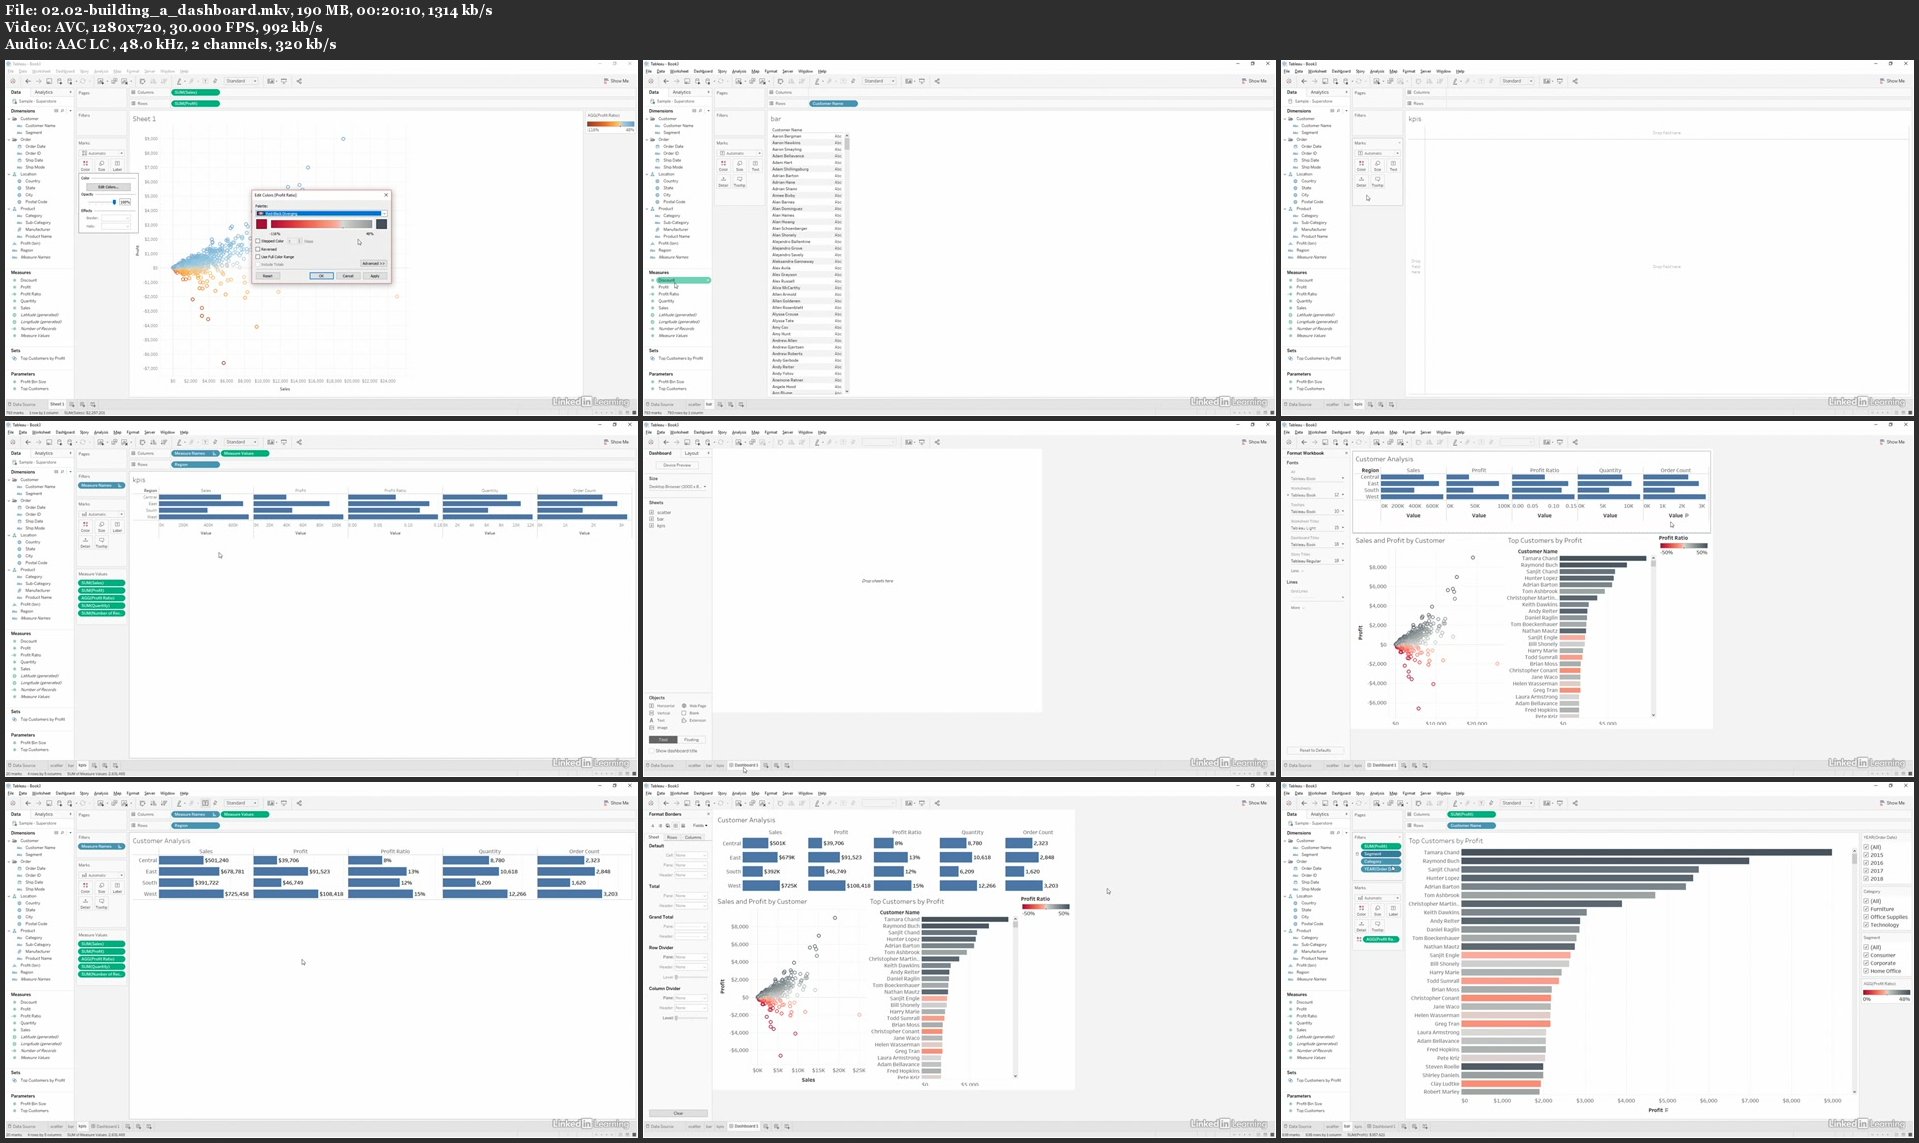
If you’re interested in working in data or looking to advance in the field, you need a foundational knowledge of several key areas of data science. Not only that, you need to be able to demonstrate that knowledge. In this four-part series, Ben Sullins shows how to build four distinct data science projects using SQL, Tableau, Python, and Spark. In this second installment, Ben details the steps in building a sales dashboard with Tableau, the popular data visualization platform favored by organizations worldwide. Ben starts by breaking down the different aspects of Tableau, from working on a desktop, to sharing data over the web, to using the Tableau Public platform to publicly share your data visualizations. He then shows Tableau in action, looking at how it facilitates a deep dive into your data, before demonstrating how to build out an exploratory dashboard with your data. At the end of the course, you’ll be able to give a live demo of your data visualizations in Tableau Public on the web.
Hands-On Data Science: 2 Sales Dashboard with Tableau