Geospatial Data Science with Python: Data Visualization
Geospatial Data Science with Python: Data Visualization
.MP4, AVC, 1280x720, 30 fps | English, AAC, 2 Ch | 7h 58m | 4.64 GB
Instructor: Michael Miller
.MP4, AVC, 1280x720, 30 fps | English, AAC, 2 Ch | 7h 58m | 4.64 GB
Instructor: Michael Miller
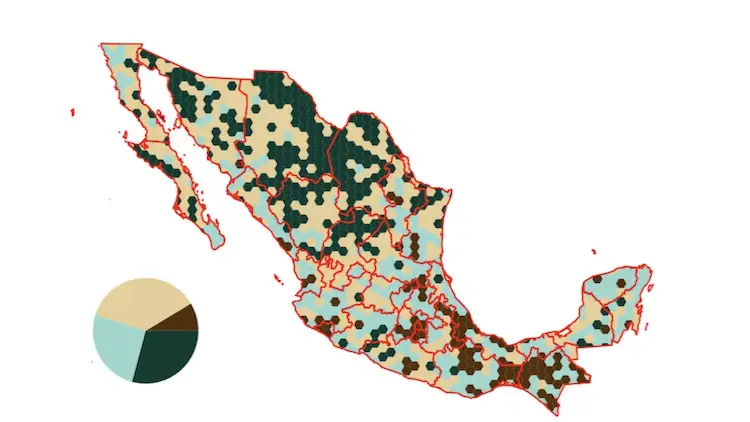
Tabular and Geospatial visualizations with Matplotlib, Pandas, Seaborn, Plotly, Bokeh, and more!
Description
Pandas and GeoPandas within a Jupyter Notebook environment provide a powerful alternative to traditional desktop GIS methods for geospatial analysis. The ability to incorporate visualizations of both tabular data and geospatial data from within your analysis workflow is one of the big advantages of this approach.
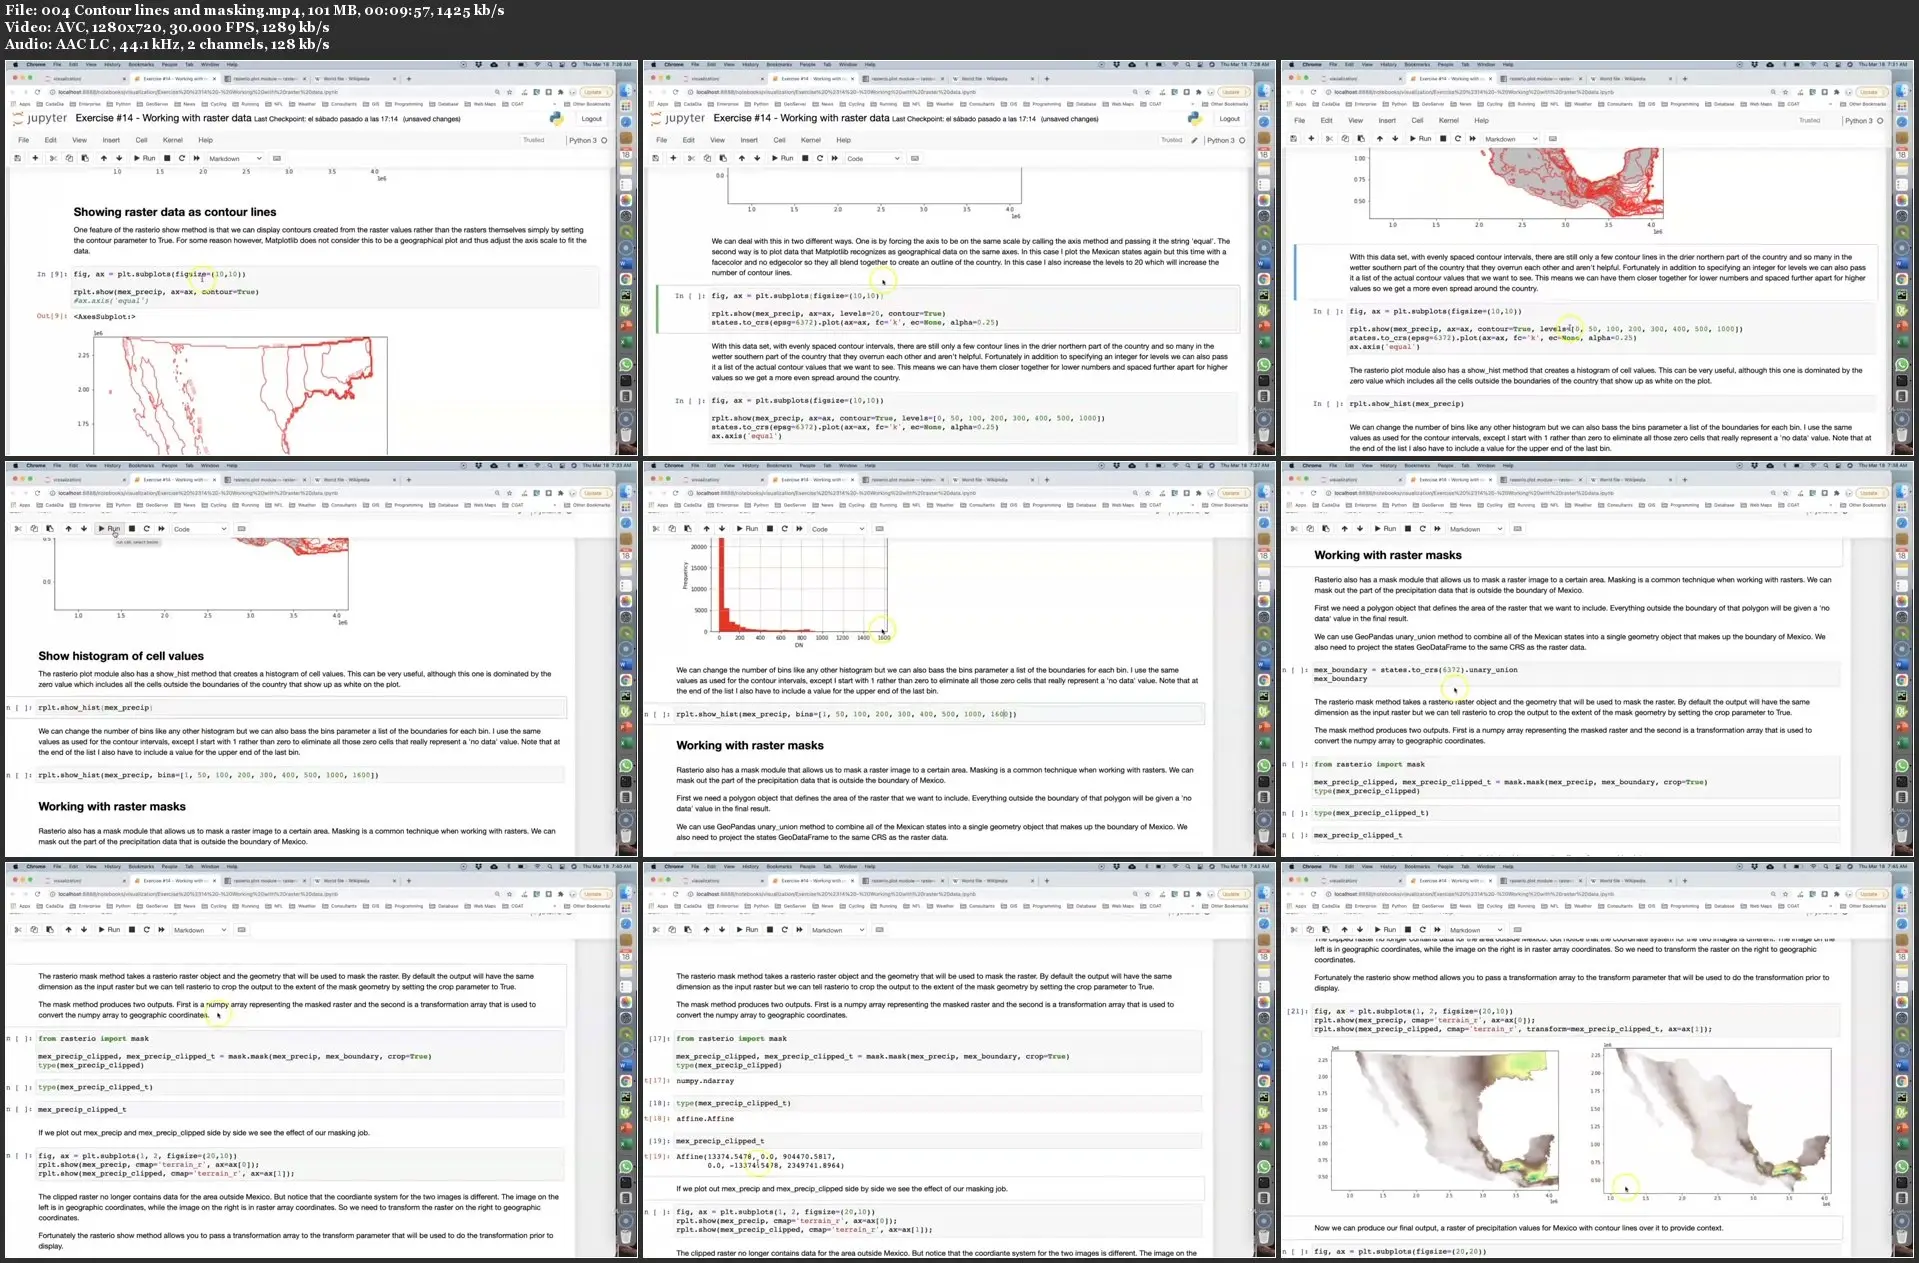
This course provides detail on how to create beautiful tabular and geospatial visualizations using Matplotlib, Pandas, GeoPandas, Rasterio, Contextily, Seaborn, Plotly, Bokeh and other Python packages within a Jupyter Notebook environment.
We start with Matplotlib because it is the core upon which all of the other static plotting methods are based. Pandas, GeoPandas, Rasterio, Contextily, and Seaborn all produce Matplotlib objects as output. If you understand Matplotlib you can use that knowledge to modify the lots put out by any of these other packages. You can control the labels and titles, place annotation on the maps, include ticks and gridlines, place legends, set the x and y limits and more. And you can control every detail of those outputs, even when the higher level plotting API's make it easy to produce the base output with a single line of code.
Plotly and Bokeh produce dynamic output that is based on JavaScript and are able to respond to mouse movements, clicks, etc.
Who this course is for:
Geospatial professionals who want to increase their knowledge of the Python Geospatial Data Science stack, especially with regards to data visualization.
Geospatial Data Science with Python: Data Visualization