Excel Power Tools for FP&A: Power Query and PowerPivot

Excel Power Tools for FP&A: Power Query and PowerPivot
.MP4, AVC, 1280x720, 30 fps | English, AAC, 2 Ch | 3h 33m | 586 MB
Instructor: Carl Seidman
.MP4, AVC, 1280x720, 30 fps | English, AAC, 2 Ch | 3h 33m | 586 MB
Instructor: Carl Seidman
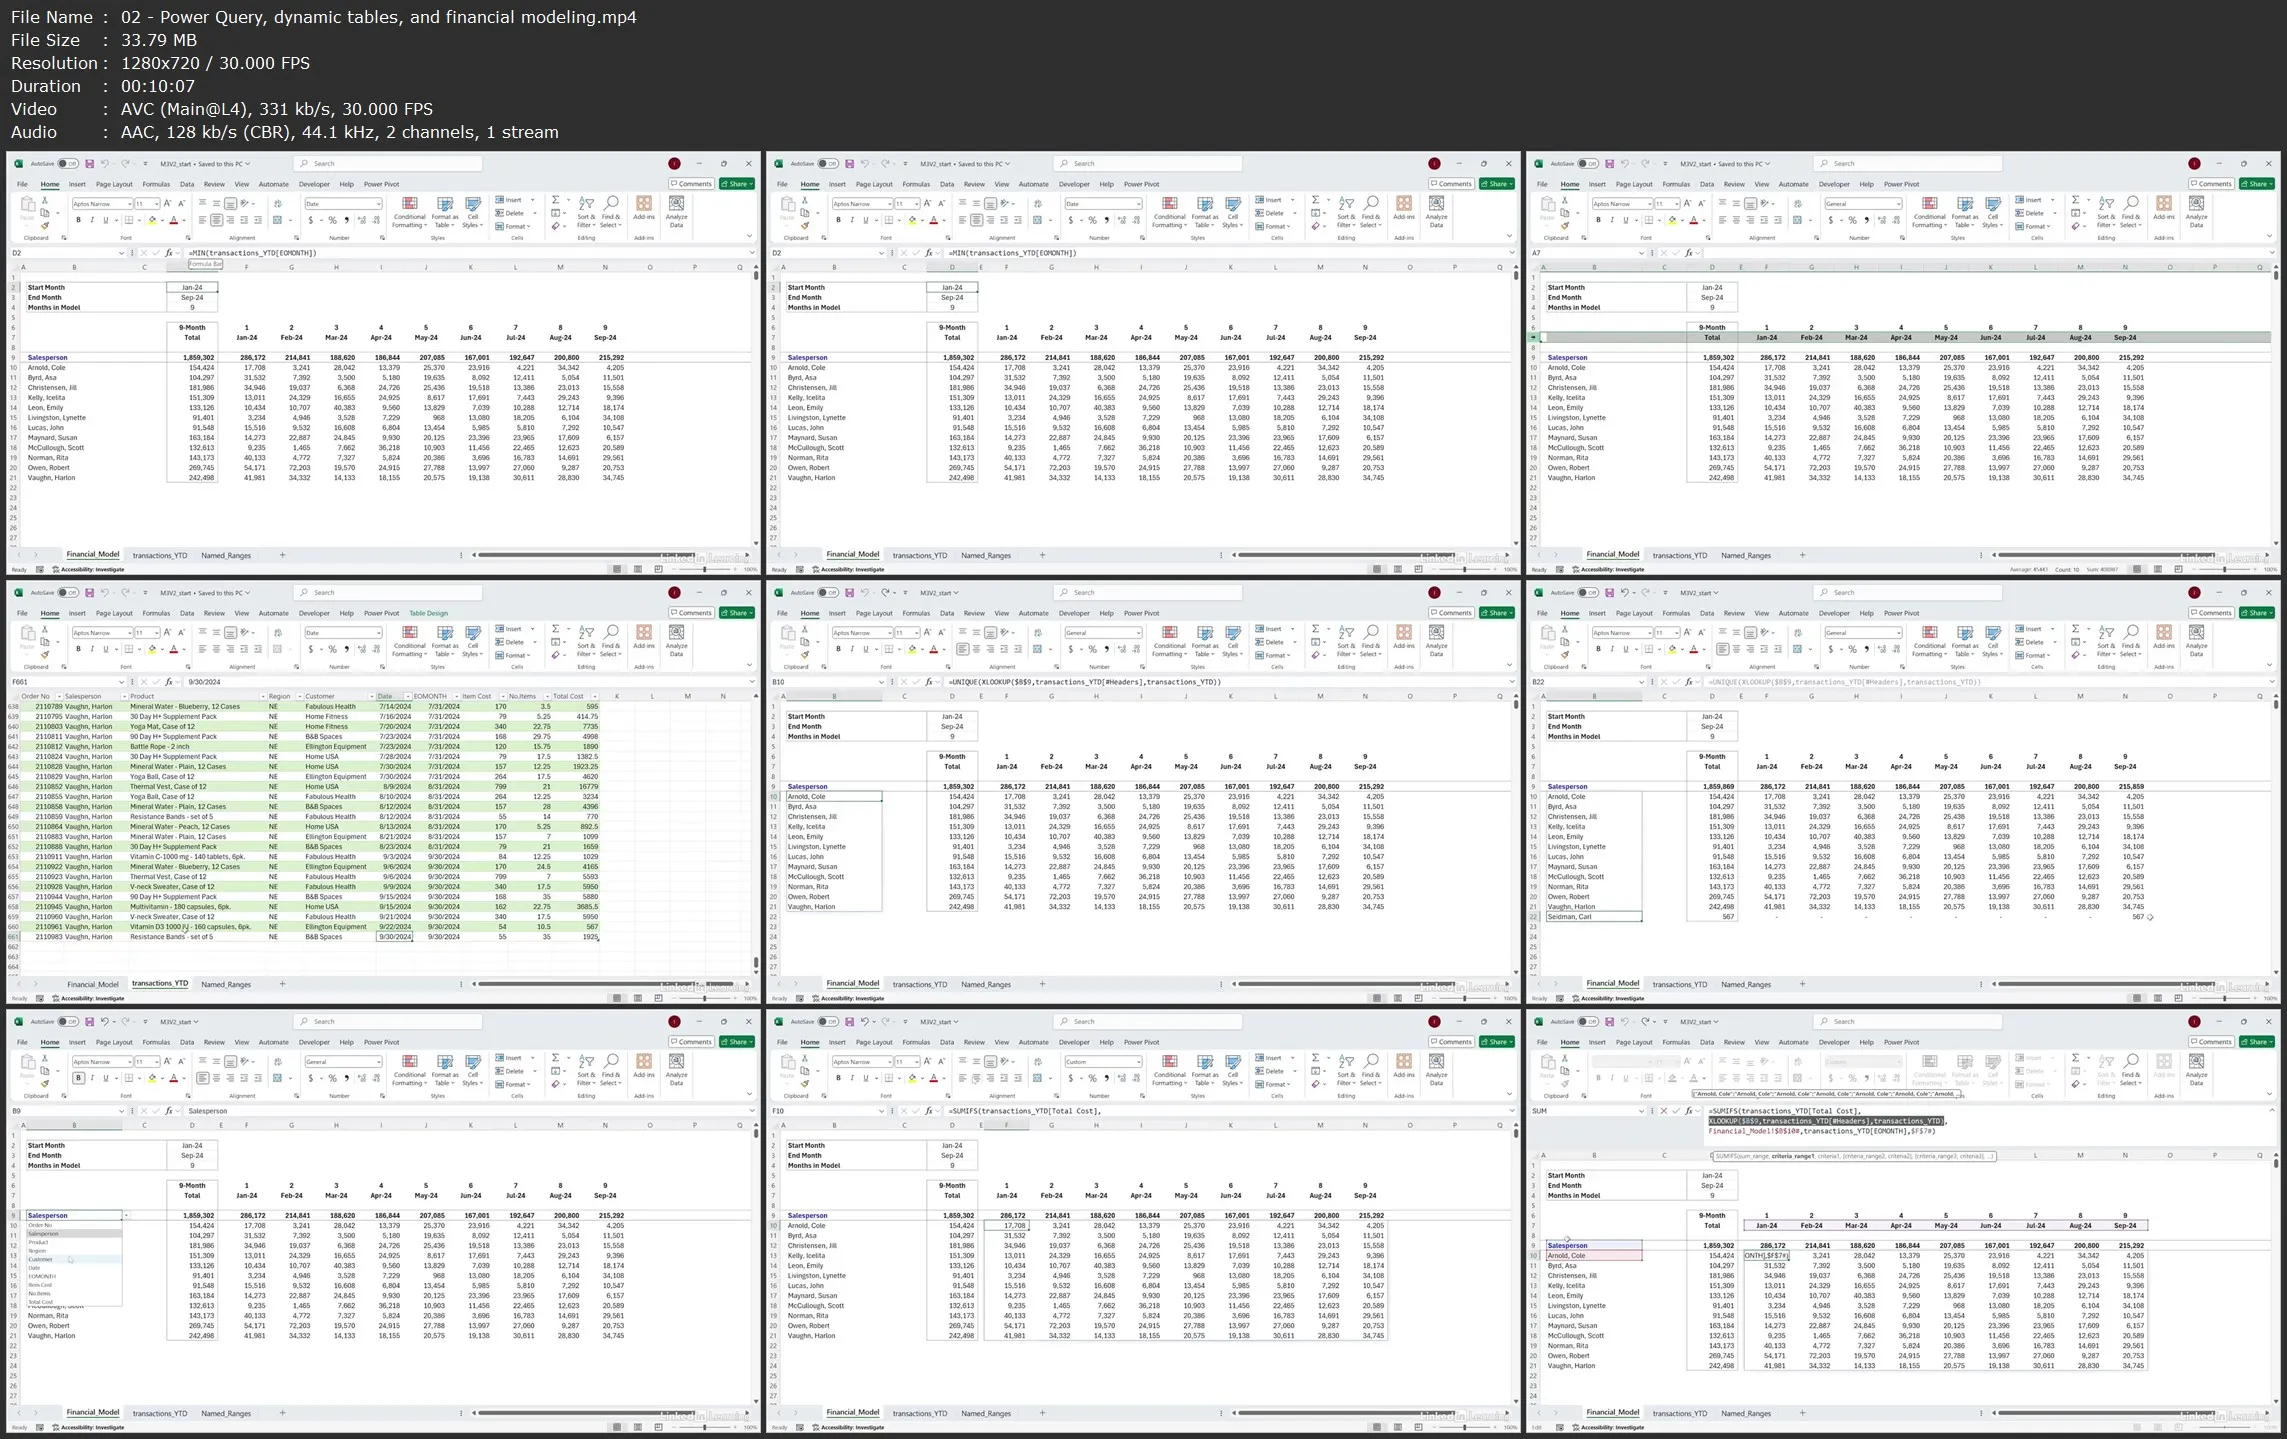
Explore ways you can effectively address the growing need for efficiency, accuracy, and actionable insights in modern FP&A workflows. In this course, Carl Seidman shows you how to connect and automate data import from various sources into Excel. Find out how Power Query can automate data cleanup, while Power Pivot can help you establish relationships among datasets for insightful analytics. Learn how to leverage DAX to create measures and calculated columns that can handle large data volumes and simplify complex calculations. Plus, discover how to create engaging dashboards using advanced Excel features like KPIs, slicers, timelines, and sets for impactful storytelling. With these skills, you'll be better prepared to lead strategic discussions and drive improvements in your organization’s financial planning and analysis processes.
Learning objectives
- Relate the role of Excel’s Power Query and Power Pivot in FP&A to traditional FP&A workflows.
- Illustrate how Power Query may be used for data preparation, mastering the user interface, performing common financial data transformations, and automating recurring tasks using applied steps.
- Show examples of Power Query for FP&A and business forecasting, driving data into tables for use in dynamic financial models.
- Understand the foundations of data modeling with the assistance Power Query by connecting tabular data between datasets and defining data hierarchies for analysis.
- Identify how Power Pivot for FP&A enhances data analysis and reporting, contrasting it with traditional PivotTables and data visualization.
- Write and apply DAX formulas for advanced analysis in financial planning and analysis applications.
Excel Power Tools for FP&A: Power Query and PowerPivot