Excel: Master the Basics of Excel Pivots for Data Analytics

Excel: Master the Basics of Excel Pivots for Data Analytics
Video: .mp4 (1280x720, 30 fps(r)) | Audio: aac, 48000 Hz, 2ch | Size: 265 MB
Genre: eLearning Video | Duration: 10 lectures (31 mins) | Language: English
Video: .mp4 (1280x720, 30 fps(r)) | Audio: aac, 48000 Hz, 2ch | Size: 265 MB
Genre: eLearning Video | Duration: 10 lectures (31 mins) | Language: English
Master Data analytics using Excel Pivot Tables and Charts | Perform Data Analytics using calculated fields and more!
What you'll learn
Build your data analysis skills from scratch
Master pivot tables, with real world examples that you will not find in any other course or textbook
Hands-on practice exercises where you will learn how to construct pivot tables as well as charts
Test your skills by practicing along-with instructor and becoming a pro by the end of the course!
Requirements
Basic experience with Excel (Formula, Charts etc.)
MS Office 2013 or later (best set up for Windows OS)
Description
Using Pivots in Excel: Master Data analysis using Pivots in Excel and gain one of employer's most requested skills in 2021!
This course is for everyone who is either completely new, or a beginner with pivots in excel. In this course, you'll learn the basics of Excel, how to work with raw data and carry out data analysis quickly using pivots.
This course does not require any prior knowledge of Excel pivots. You should be comfortable working with data and prior knowledge of Excel may prove in handy to understand some of the tools and functionalities taught in this course.
This course is excellent to kickstart your path to becoming proficient in Excel, you'll learn all the basics to get you started and applying at your job right away!
With the "Mastering Pivots in Excel" course you will learn how to use Excel pivots from scratch and start solving several real world problems
Excel Pivot tables are absolute essential for anyone working with large and complex datasets!
Pivots allow you to quickly cut through the noise and deep dive into the datasets. Be it analyzing YoY growth rates, looking at market share trends, product profitability and so on - pivots allow to process large datasets and derive insights quickly
You'll be learning when, how and why to use excel pivot tables as well as charts as part of your day to day analysis. You'll be learning the following-
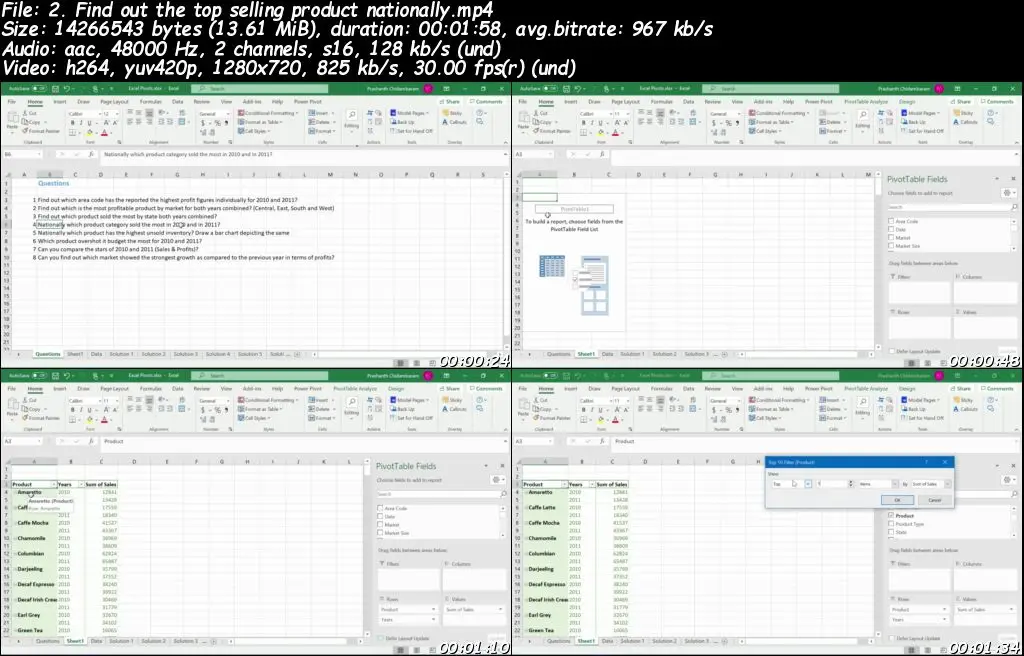
a. Understanding raw data structures
b. Building basic pivot tables choosing relevant rows, column and values
c. Using calculated fields
d. Using sort, filter and grouping tools within pivots
e. Summarize pivot table values by sum, average, count etc.
e. Modifying Pivot tables - titles, table formatting
f. Display outputs through pivot charts
Whether you're looking to explore Excel Pivot Tables for the first time, or are looking to brush up your skills with hands- on exercises. You have come to the right place.
In the bonus section, you would be exposed to slicer tools that let's you filter multiple pivots and draw insights on multiple parameters at once.
This course is compatible on Excel 2010 or later.
Who this course is for:
Anyone who works on a regular basis on Excel and has not explored pivots
Anyone looking to pursue a long-term career as a data analyst, data scientist, or researcher etc.
Excel: Master the Basics of Excel Pivots for Data Analytics