Excel Pivot Tables: Master Data Analysis and Dashboards

Excel Pivot Tables: Master Data Analysis and Dashboards
Video: .mp4 (1280x720, 30 fps(r)) | Audio: aac, 44100 Hz, 2ch | Size: 2.71 GB
Genre: eLearning Video | Duration: 4 hour | Language: English
Video: .mp4 (1280x720, 30 fps(r)) | Audio: aac, 44100 Hz, 2ch | Size: 2.71 GB
Genre: eLearning Video | Duration: 4 hour | Language: English
Learn Excel Pivot Tables hands-on: Perform Data Analysis and build your own Excel Dashboards (Microsoft Excel 2010-2019).
What you'll learn
Learn how to create Pivot Tables in Microsoft Excel
Perform Data Analysis, Create PivotCharts and let your data speak
Create a reporting dashboard to perform data analysis with Pivot Tables
Get to know many tips & tricks around Excel Pivot Tables
Test your skills, perform data analysis and answer several questions (including solution guide)
Performing data cleanups before creating Excel Pivot Tables
Requirements
Microsoft Excel 2007 - 2019/365 (PC Windows version Excel 2010 or higher recommended)
Please note that this course runs on a Windows environment. Mac users are welcome and certainly can transfer their new skills, but the whole user interface differs on Apple Mac environments.
Basic know how in Excel is recommended, but not a must. We start from scratch when it comes to Excel Pivot Tables.
Description
What is this Pivot Tables course about?
Excel Pivot Tables are one of the most powerful tools that come with Microsoft Excel. They are a must for any data analyst to dig into data, perform data analysis and draw conclusions.
What is a Pivot Table?
The word “Pivot” itself is defined as the central point, pin, or shaft on which a mechanism turns or oscillates. And that is exactly what pivot tables do. A Pivot Table turns your data. Pivot tables are also known as so called cross tables.
A Pivot Table is a very powerful Excel tool for structurally evaluating data in a simple tabular form. The underlying data source is summarised in a way that important properties of the data are represented in a simple overview of aggregated data.
Why do you need Excel Pivot Tables?
With Pivot Tables you basically flip your data to explore new dimensions to perform data analysis. This tool allows you to break down and reduce huge amounts of data to a basic tabular form that reveals new insights about your data.
In addition you can create stunning Excel Dashboards with the help of Excel Pivot Tables. With so called "slicers" you can enrich your data analysis and summaries with a user friendly interface to dig into your data. This way you can draw conclusions that you may not even have thought of beforehand.
With the right approach you can perform data analysis on any kind of data such as sales data or marketing performance data. Whatever your use case will be. With Pivot Tables you have a tool at hand which allows you to create any kind of KPI driven Excel dashboards to draw meaningful and actionable insights.
This Pivot Tables course gives you a comprehensive and hands-on deep dive through the ins and outs of Pivot Tables and related data analysis. You will learn everything from scratch, like properly preparing your raw data, creating pivot tables, adding charts and filters up to eventually creating a fully functional reporting Excel Dashboard. But it's not only me doing stuff in this course. There is an exercise teaching section waiting for you. You receive a raw data set on that you will run some data analysis on your own. With the help of Pivot Tables you will then answer a bunch of questions.
You will follow me directly on my screen and can work in parallel with the provided Excel work files.
Find some of the most important topic areas of this course below:
Data Requirements to your raw data
How to tackle a Data Clean up
Performing Data Analysis with Pivot Tables
360° exploration of Navigation and Menus around Pivot Tables
Creating Pivot Charts
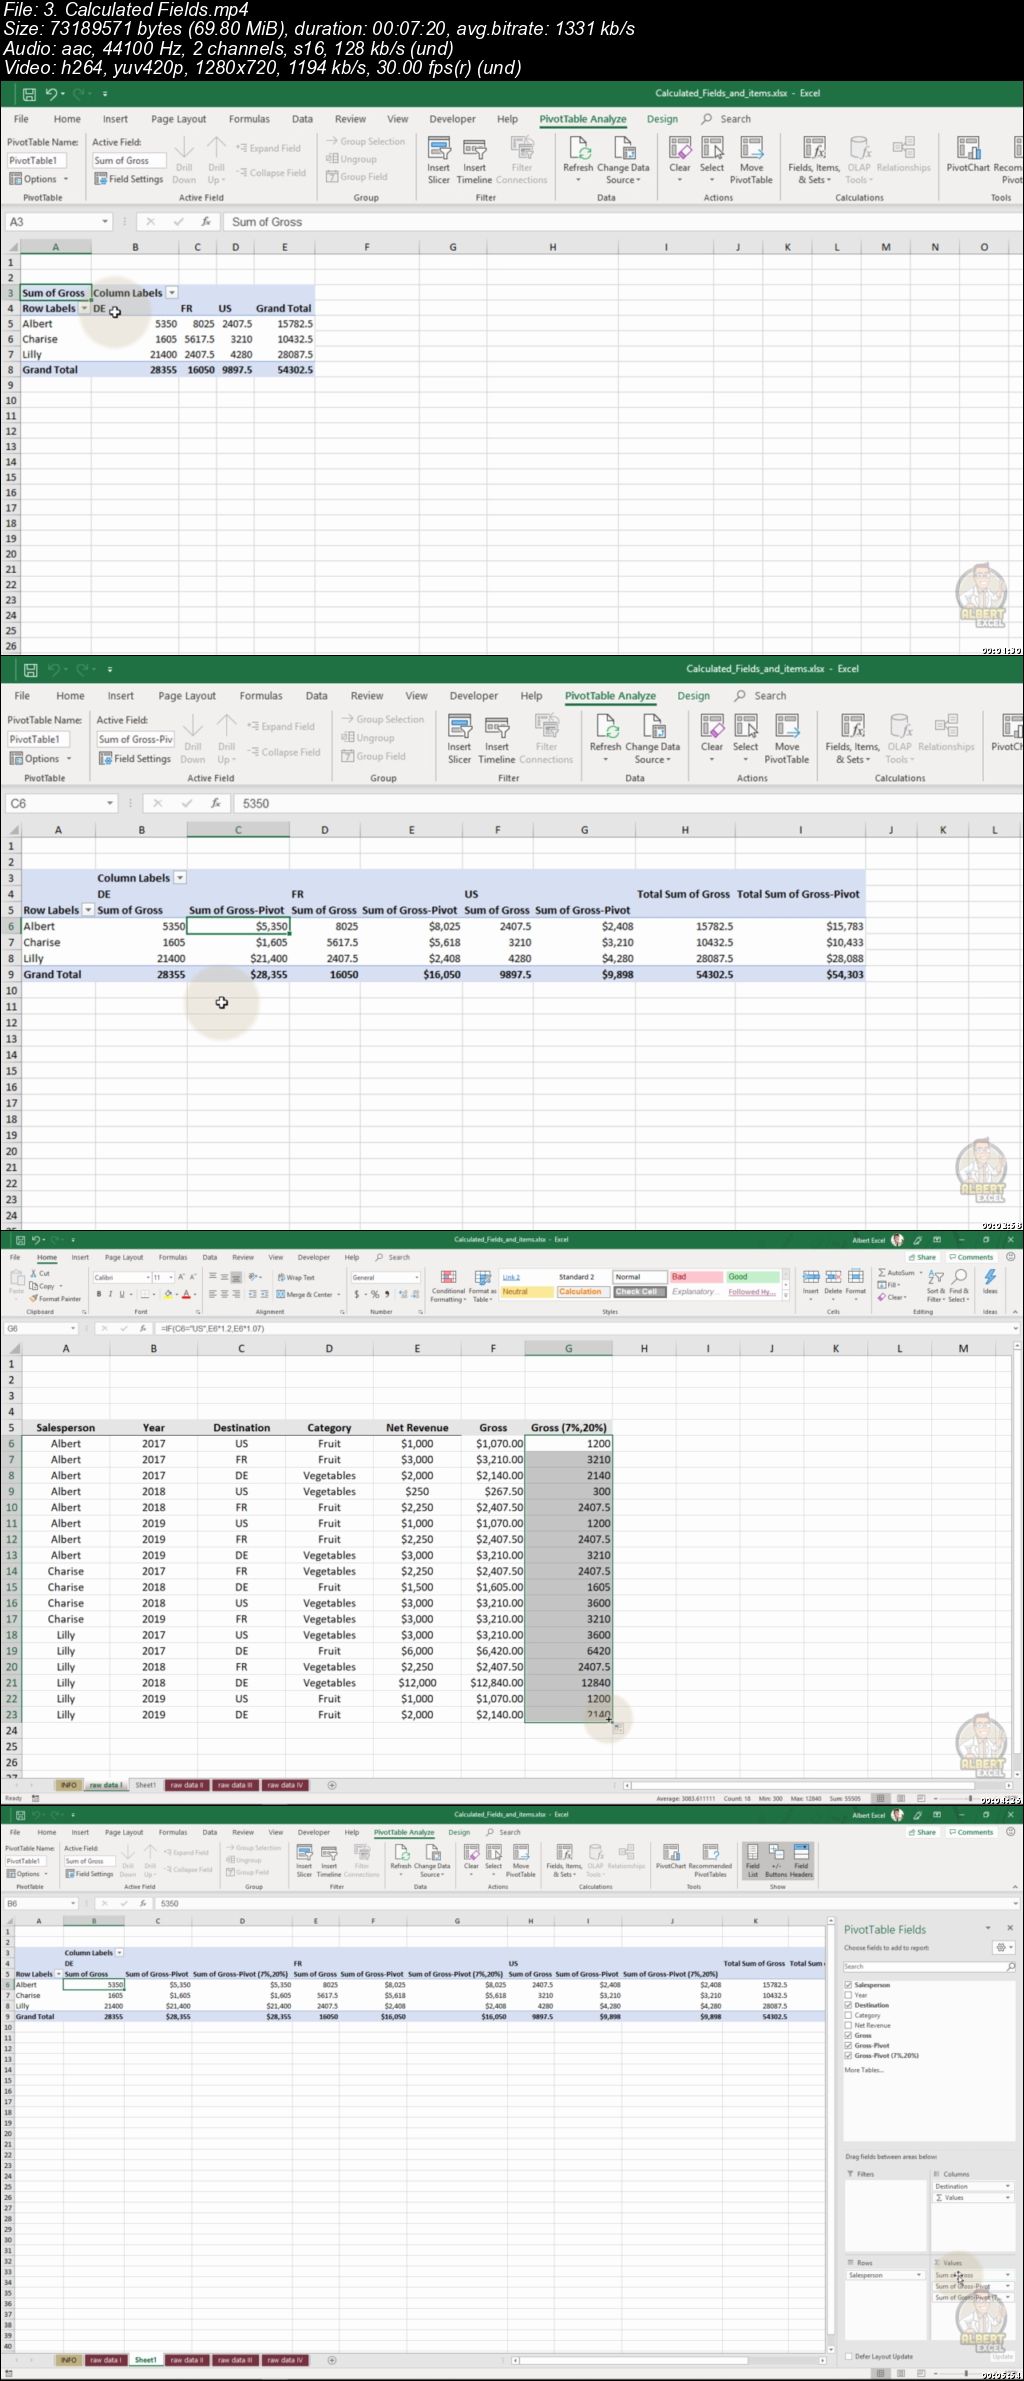
Calculated Fields and Items (and all the pitfalls of those)
Create Interactive Excel Dashboards with Pivot Tables (Excel 2010 and higher)
Pimping up usability with slicers and timelines (Excel 2010 and higher)
Test your Pivot Tables skills, run your own data analysis and answer questions
This course is a hands-on experience and we will work with a sample data set to explore all the functionalities around Pivot Tables. You can work in parallel with the Excel work files to try everything out, one by one, as I am showing you on my screen.
In a world, where data analytics become more and more a demanded skill in businesses, this course is exactly the right place to start extending your Microsoft Excel skills. After this course you are able to transform any kind of raw data into meaningful summaries, run your own data analysis and draw conclusions, all with the help of Excel Pivot Tables.
I am here to help you levelling up in Excel. So, I am more than happy to welcome you on the other side in my course.
Cheers,
Georg - Certified Microsoft Office Specialist Expert (Excel)
Who this course is for:
Anyone who wants to level up their Excel skills
Excel users with some basic knowledge about Microsoft Excel
Students who are looking for a hands on learning experience to learn Excel Pivot Tables
Students who want to perform data analysis with Excel Pivot Tables
Excel Pivot Tables: Master Data Analysis and Dashboards