Excel for Financial Analysis and Financial Modeling

Excel for Financial Analysis and Financial Modeling
Video: .mp4 (1280x720, 30 fps(r)) | Audio: aac, 44100 Hz, 2ch | Size: 2.92 GB
Genre: eLearning Video | Duration: 59 lectures (7 hour, 19 mins) | Language: English
Video: .mp4 (1280x720, 30 fps(r)) | Audio: aac, 44100 Hz, 2ch | Size: 2.92 GB
Genre: eLearning Video | Duration: 59 lectures (7 hour, 19 mins) | Language: English
Perform financial analysis & financial modeling using Microsoft excel. For people who want to become a Financial Analyst
What you'll learn
Use MS excel to create and automate the calculation of Financial ratios
Become proficient in Excel data tools like Sorting, Filtering, Data validations and Data importing
Implement predictive ML models such as simple and multiple linear regression to predict outcomes to real world Finance problems
Knowledge of all the essential Excel formulas required for Financial Analysis
Requirements
You will need a PC with any version of Excel installed in it
Description
How this course will help you?
A Verifiable Certificate of Completion is presented to all students who undertake this Financial Analytics: Strategies & Models in Excel course.
If you are an Finance manager or an executive, or a student who wants to learn and apply analytics techniques to real world problems of the Finance business function, this course will give you a solid base for that by teaching you the most popular Financial analytics models and how to implement it them in MS Excel.
Why should you choose this course?
We believe in teaching by example. This course is no exception. Every Section’s primary focus is to teach you the concepts through how-to examples. Each section has the following components:
Theoretical concepts and use cases of different Financial models
Step-by-step instructions on implementing Financial models in excel
Downloadable Excel files containing data and solutions used in each lecture
Class notes and assignments to revise and practice the concepts
The practical classes where we create the model for each of these strategies is something which differentiates this course from any other course available online.
What makes us qualified to teach you?
The course is taught by Abhishek (MBA - FMS Delhi, B.Tech - IIT Roorkee) and Pukhraj (MBA - IIM Ahmedabad, B.Tech - IIT Roorkee). As managers in Global Analytics Consulting firm, we have helped businesses solve their business problem using Analytics and we have used our experience to include the practical aspects of HR analytics in this course
We are also the creators of some of the most popular online courses - with over 600,000 enrollments and thousands of 5-star reviews like these ones:
This is very good, i love the fact the all explanation given can be understood by a layman - Joshua
Thank you Author for this wonderful course. You are the best and this course is worth any price. - Daisy
Our Promise
Teaching our students is our job and we are committed to it. If you have any questions about the course content, practice sheet or anything related to any topic, you can always post a question in the course or send us a direct message.
Download Practice files, take Quizzes, and complete Assignments
With each lecture, there are class notes attached for you to follow along. You can also take quizzes to check your understanding of concepts. Each section contains a practice assignment for you to practically implement your learning.
What is covered in this course?
The analysis of data is not the main crux of analytics. It is the interpretation that helps provide insights after application of analytical techniques that makes analytics such an important discipline. We have used the most popular analytics software tool which is MS Excel. This will aid the students who have no prior coding background to learn and implement analytics concepts to actually solve real-world HR problems.
Let me give you a brief overview of the course
Part 1 - Introduction
In this section we will learn about the course structure and the meaning of some key terms associated with HR Analytics.
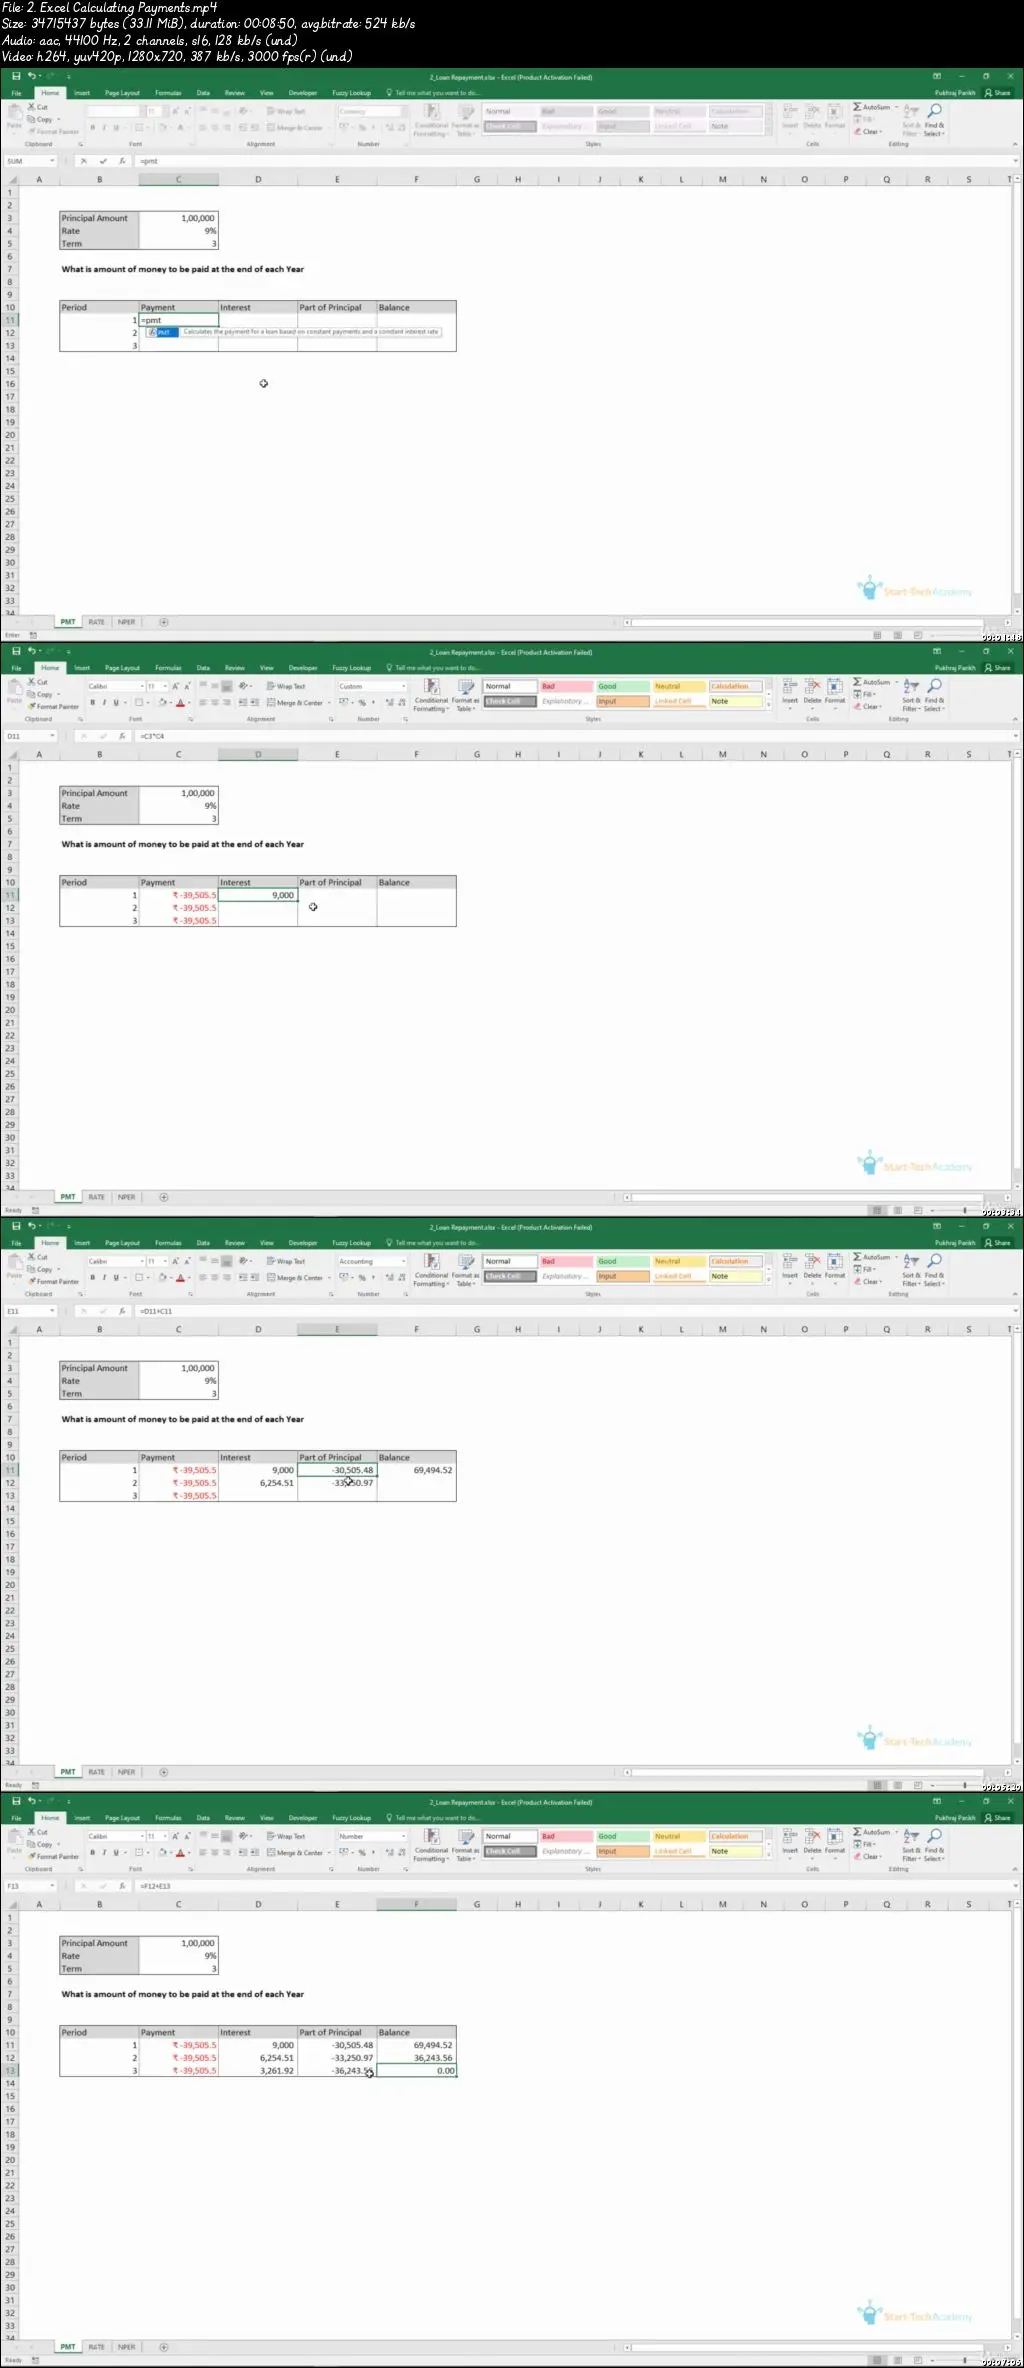
Part 2 - Essential MS Excel formulas and using them to calculate Financial metrics
In this part, we will start with a tutorial on all the popular MS Excel formulas. Then we will see the implementation of these to calculate and automate the HR metrics. We also discuss a separate case study where we use Excel to calculate the average cost of external and internal hiring.
Part 3 - Visualization in Excel and Financial Dashboarding
In this part, we will begin with a tutorial on all the popular charts and graphs that can be drawn in MS Excel. Then we will see the implementation of these to create visualize HR data. We also discuss a separate case study where we use Excel to build a department wise demographic distribution of human resources.
Part 4 - Data summarization using Pivot tables
In this part, we will learn about several advanced advanced topics in MS Excel such as Pivot tables, indirect functions and also about the data formatting. Then we will see the implementation of these to create beautiful summaries of HR Data. We also discuss a separate case study where we use Excel to build a dynamic department wise demographic dashboard and format it to make it presentable.
Part 5 - Basics of Machine Learning and Statistics
In this part, we introduce the students to the basics of statistics and ML. This part is for students who have no background understanding of ML and statistics concepts
Part 6 - Preprocessing Data for ML models
In this section you will learn what actions you need to take a step by step to get the data and then prepare it for the analysis these steps are very important. We start with understanding the importance of business knowledge then we will see how to do data exploration. We learn how to do uni-variate analysis and bi-variate analysis then we cover topics like outlier treatment, missing value imputation, variable transformation and correlation.
Part 7 - Linear regression model for predicting metrics
This section starts with simple linear regression and then covers multiple linear regression.
We have covered the basic theory behind each concept without getting too mathematical about it so that you understand where the concept is coming from and how it is important. But even if you don't understand it, it will be okay as long as you learn how to run and interpret the result as taught in the practical lectures.
We also look discuss an HR case study where we try to predict the CTC to be offered to new recruits basis their previous experience, past CTC, job location and qualification.
I am pretty confident that the course will give you the necessary knowledge and skills to immediately see practical benefits in your work place.
Go ahead and click the enroll button, and I'll see you in lesson 1
Cheers
Start-Tech Academy
Who this course is for:
Anyone curious to master Excel for Financial Analysis in short span of time
Financial Analysts/ Managers who wants to expand on the current set of skills
Excel for Financial Analysis and Financial Modeling