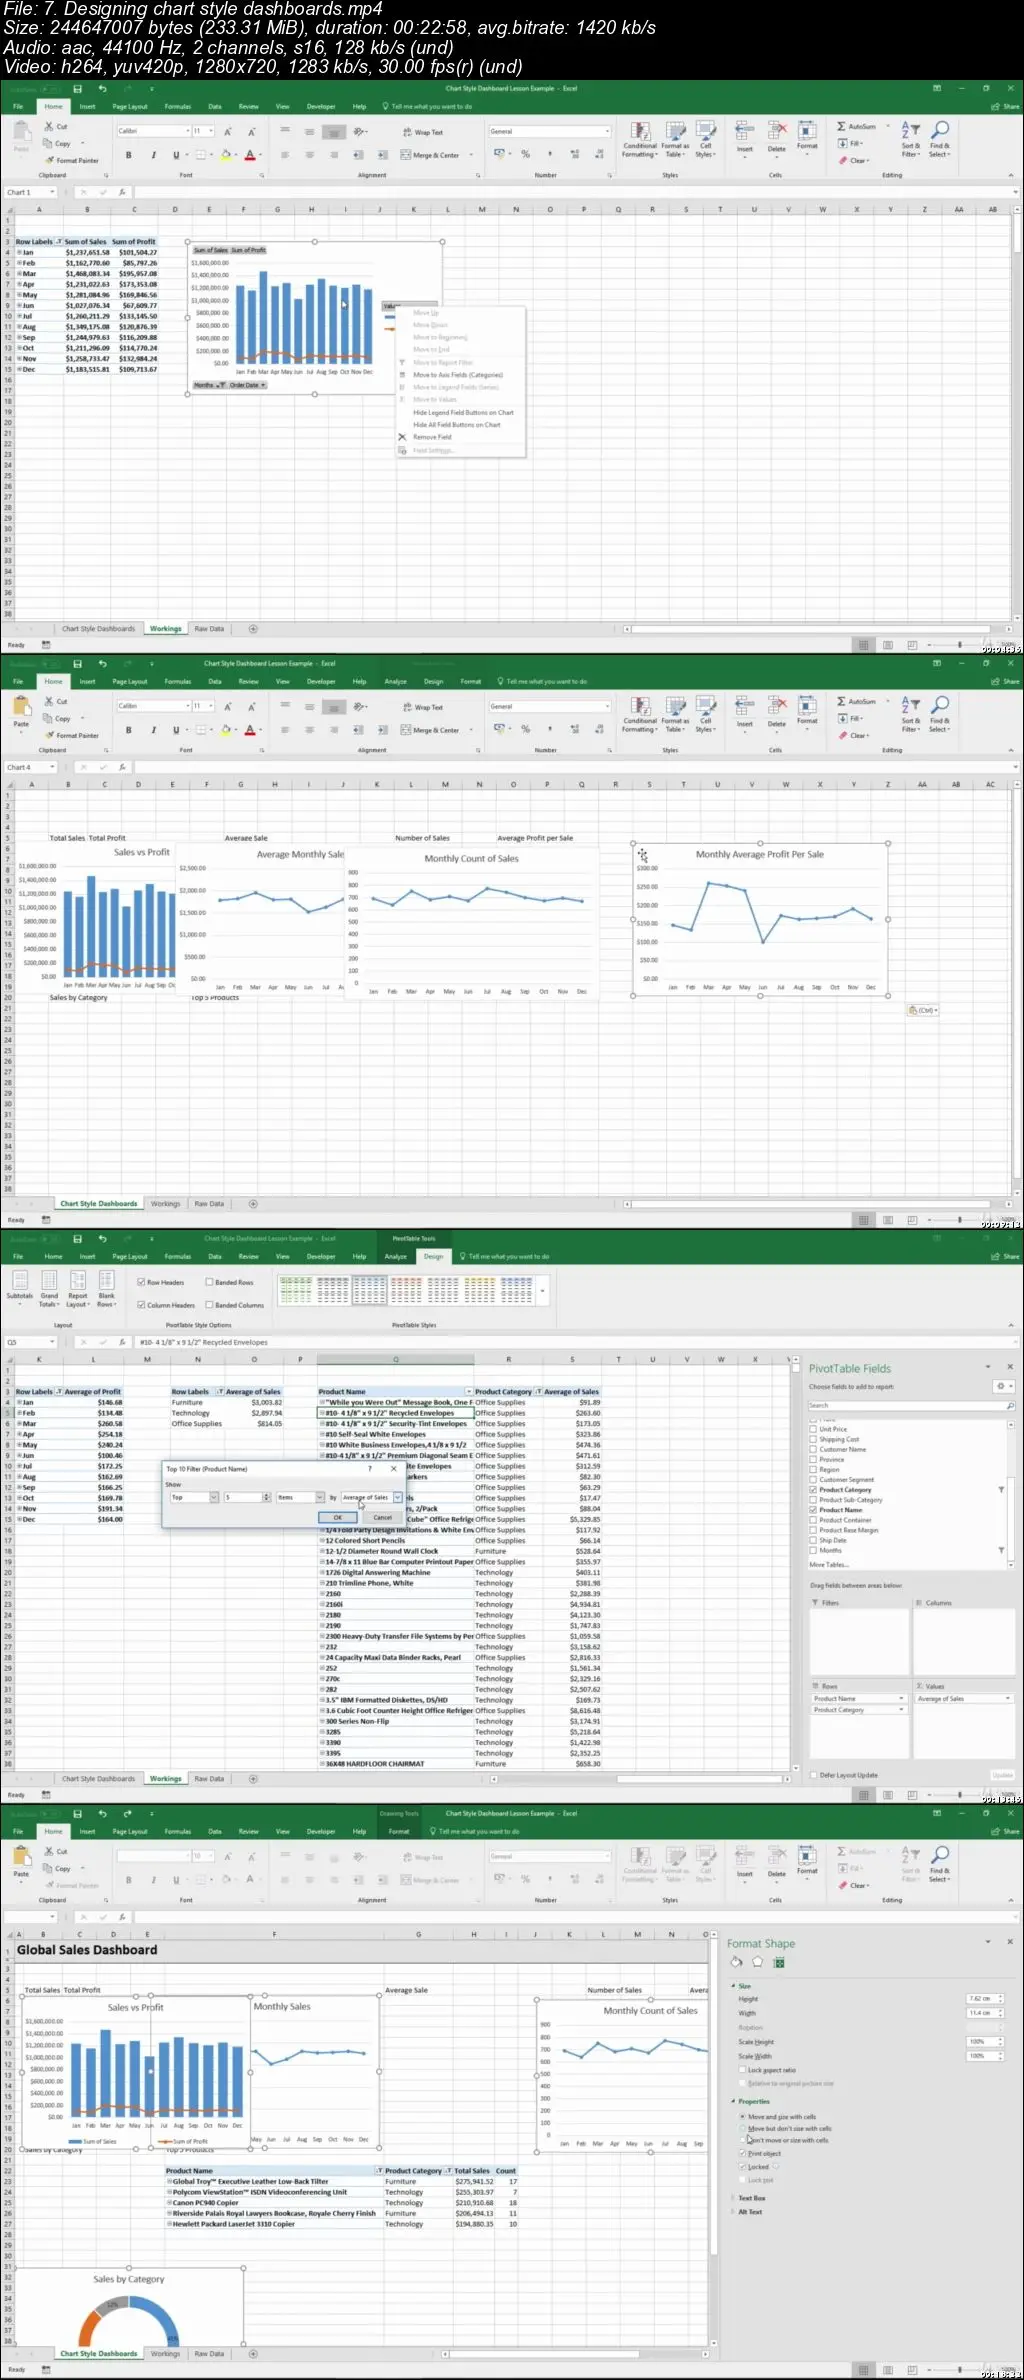
Your Excel Data Analysis Playbook

Your Excel Data Analysis Playbook
.MP4 | Video: 1280x720, 30 fps(r) | Audio: AAC, 44100 Hz, 2ch | 1.39 GB
Duration: 2.5 hours | Genre: eLearning | Language: English
.MP4 | Video: 1280x720, 30 fps(r) | Audio: AAC, 44100 Hz, 2ch | 1.39 GB
Duration: 2.5 hours | Genre: eLearning | Language: English
Transform your spreadsheets into Excel Charts, Pivot Tables, Pivot Charts, and create great looking Excel Dashboards.
What you'll learn
Prepare your data for charts
Create a variety of charts and graphs in Excel including Line, Bar, Pie, Bubble, Scatter and more
Create pivot tables to analyse your data + understand advanced pivot table functionality
Create pivot charts to quickly turn pivot tables into great looking charts
Design and create great looking Excel dashboards and reports
Requirements
Microsoft Excel 2007 - 2019 or Office 365 for Windows (Some features may not be available in earlier versions)
Description
Welcome to Your Excel Data Analysis Playbook, a powerful course to fast track your knowledge of Excel data analysis and Excel Dashboards.
I'm guessing you're perhaps a beginner to intermediate Excel user, looking to improve your Excel skills, to further your career, to become better & faster at Excel, or to impress your boss.
Analysing data in Excel can seem intimidating and technical; and making your work look good can be time consuming and error prone.
In this course, I'm going to show you how to go from raw data to great looking reports, using a repeatable method that you can use over and over again. Once you take this course, you will be able to to analyse almost any Excel data set you're ever likely to come across in your career.
Not only that but you'll learn some new Excel functionality along the way, including Charts, Pivot Tables and Pivot Charts.
At the end of this course, you'll be confident and proficient about analysing data using Excel Pivot Tables, Excel Charts, Excel Pivot Charts and great looking Excel Dashboards.
This course works through step-by-step how to get from raw data to great looking reports. Each lesson has a practical, real life example that we work through, and that you can download afterwards.
There are downloadable challenges that you can work through in your own time, and there's a quiz at the end of the course to test your knowledge.
The course comes with a downloadable dashboard template, which you can use to start using to build reports, and a Pivot Tables cheat sheet, to have at your desk side for quick reference.
You also get access to my private facebook community, where you can ask me any Excel question and get a personal answer (worth far in excess of the price of this course!)
There's several free preview lessons below, so that you can get started, and I look forward to seeing you on the course!
Who this course is for:
Your Excel Functions Toolkit is course for intermediate level Excel users who are familiar with the basics of Excel features.
Your Excel Data Analysis Playbook