Tags
Language
Tags
June 2025
Su Mo Tu We Th Fr Sa
1 2 3 4 5 6 7
8 9 10 11 12 13 14
15 16 17 18 19 20 21
22 23 24 25 26 27 28
29 30 1 2 3 4 5
    Attention❗ To save your time, in order to download anything on this site, you must be registered 👉 HERE. If you do not have a registration yet, it is better to do it right away. ✌

    https://sophisticatedspectra.com/article/drosia-serenity-a-modern-oasis-in-the-heart-of-larnaca.2521391.html

    DROSIA SERENITY
    A Premium Residential Project in the Heart of Drosia, Larnaca

    ONLY TWO FLATS REMAIN!

    Modern and impressive architectural design with high-quality finishes Spacious 2-bedroom apartments with two verandas and smart layouts Penthouse units with private rooftop gardens of up to 63 m² Private covered parking for each apartment Exceptionally quiet location just 5–8 minutes from the marina, Finikoudes Beach, Metropolis Mall, and city center Quick access to all major routes and the highway Boutique-style building with only 8 apartments High-spec technical features including A/C provisions, solar water heater, and photovoltaic system setup.
    Drosia Serenity is not only an architectural gem but also a highly attractive investment opportunity. Located in the desirable residential area of Drosia, Larnaca, this modern development offers 5–7% annual rental yield, making it an ideal choice for investors seeking stable and lucrative returns in Cyprus' dynamic real estate market. Feel free to check the location on Google Maps.
    Whether for living or investment, this is a rare opportunity in a strategic and desirable location.

    DevOps Monitoring Deep Dive

    Posted By: IrGens
    DevOps Monitoring Deep Dive

    DevOps Monitoring Deep Dive
    .MP4, AVC, 1920x1080, 30 fps | English, AAC, 2 Ch | 3h 51m | 1.51 GB
    Instructor: Elle Krout

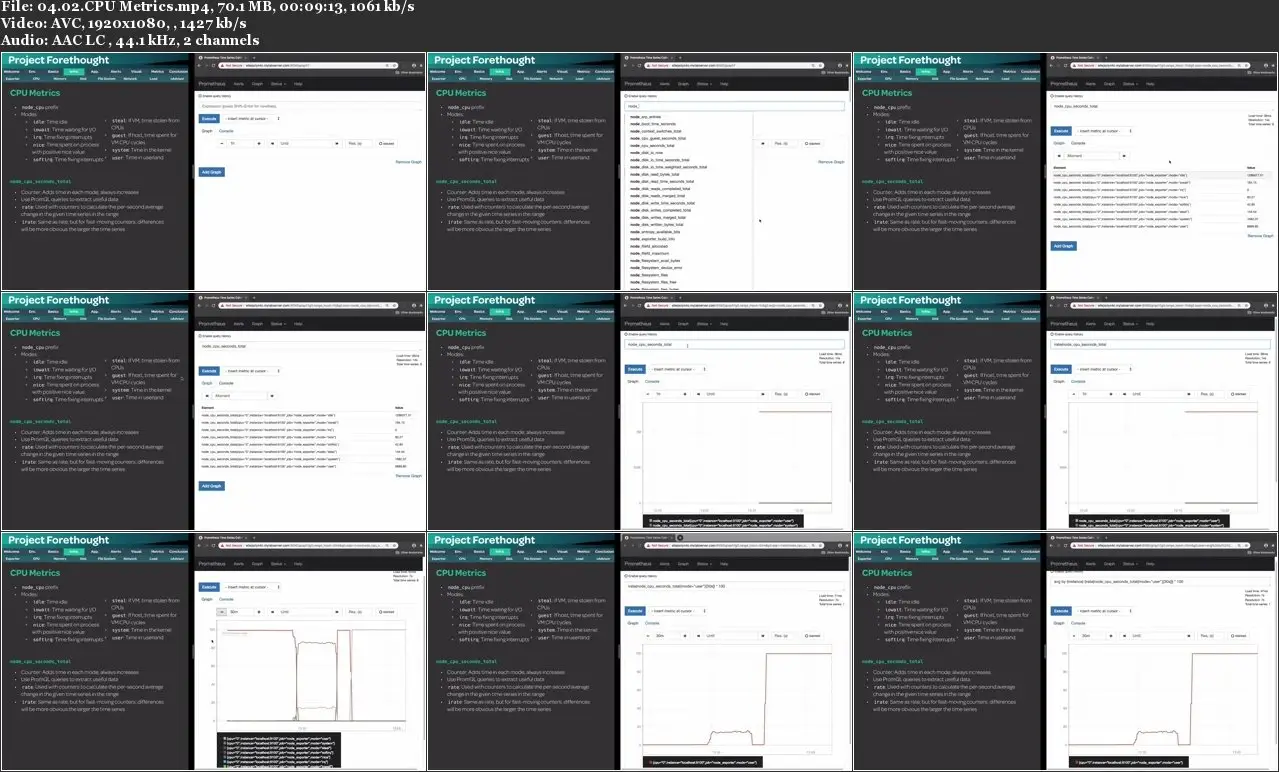
    In the DevOps Monitoring Deep Dive, we use Prometheus, Alertmanager, and Grafana to demonstrate monitoring concepts that we can use on any monitoring stack. We start by building a foundation of some general monitoring concepts, then get hands-on by working with common metrics across all levels of our platform.

    We'll exploring infrastructure monitoring by using Prometheus's Node Exporter and viewing statistic about our CPU, memory, disk, file system, basic networking, and load metrics. We'll also take a look at how to monitor any contrainers we may be using on our virtual machine.

    Once our infrastructure monitoring is up and running, we'll take a look at a basic Node.js application and use a Prometheus client libary to track metrics across our application.

    Finally, we look at how we can get the most out of our metrics by learning how to add recording and alerting rules, then building out a series of routes so any alerts we create can get to their desired endpoint. We'll also look at creating persistent dashboards with Grafana and use its various graphing options to better track our data.


    DevOps Monitoring Deep Dive