Coding to analyze and visualize data: a class of examples

Coding to analyze and visualize data: a class of examples
Video: .mp4 (1280x720, 30 fps(r)) | Audio: aac, 48000 Hz, 2ch | Size: 23.7 GB
Genre: eLearning Video | Duration: 94 lectures (31 hours, 8 mins) | Language: English
Video: .mp4 (1280x720, 30 fps(r)) | Audio: aac, 48000 Hz, 2ch | Size: 23.7 GB
Genre: eLearning Video | Duration: 94 lectures (31 hours, 8 mins) | Language: English
Learn the Python programming language, pandas & Matplotlib! Data Analysis & Visualization for all. No experience needed!
What you'll learn
Read, write, and analyze data with pandas
Create line, scatter, candlestick, and 3D plots in Matplotlib
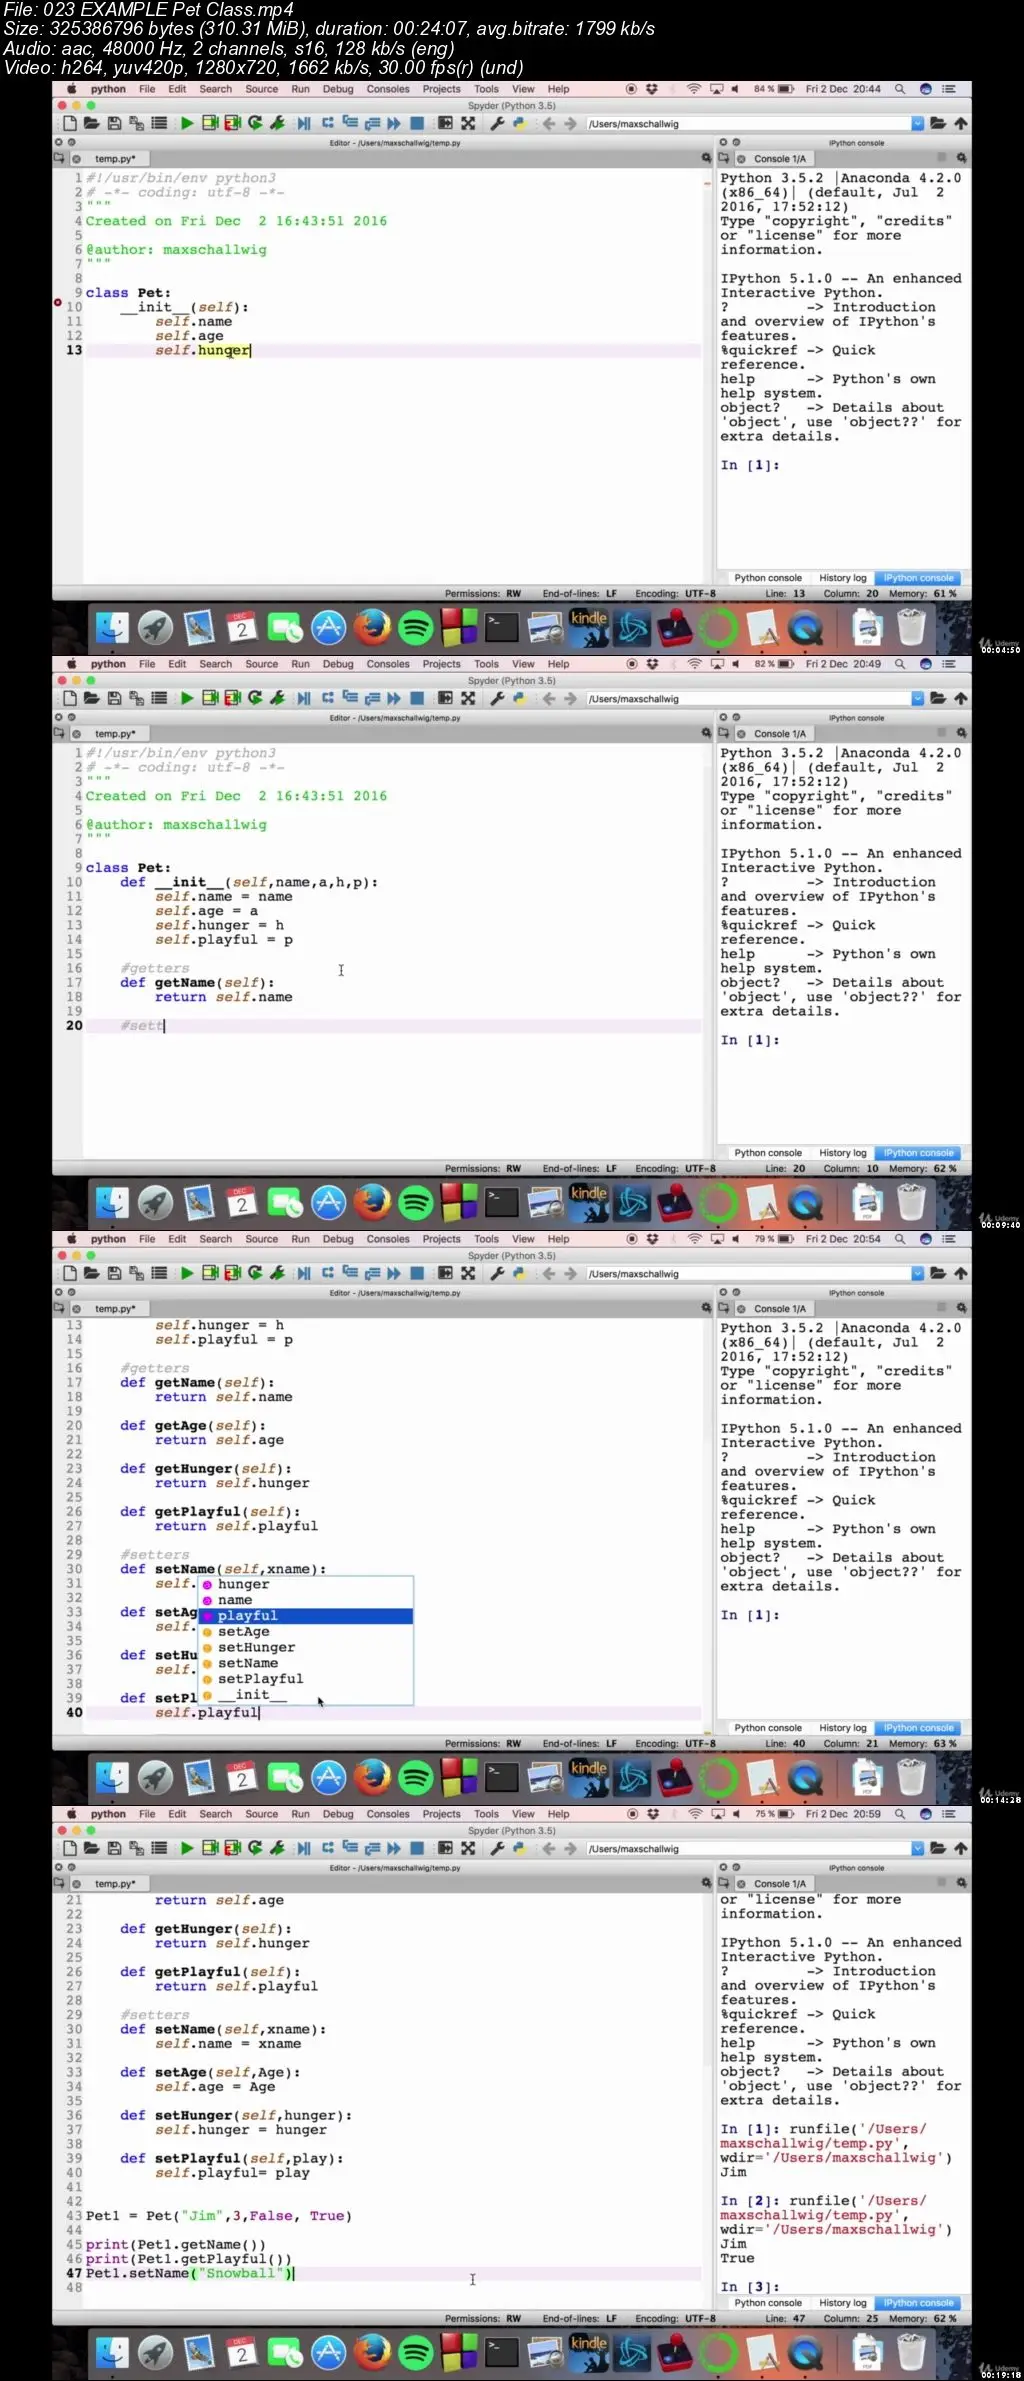
Learn to code in Python from scratch
Visualize data with histograms, pie charts, and box and whisker plots
And much more!
Requirements
Anaconda, which includes Python, pandas, and Matplolib
Topics involve intermediate math, so familiarity with university-level math is very helpful.
Description
Anyone - even if you have no programming experience - can learn to code in Python with Mammoth Interactive. Learn to analyze and visualize data with bars, diagrams, and graphs.
This course was funded by a wildly successful Kickstarter
This course is fun, project-filled, and practical.
If you want to do any of the following…
Visualize data with histograms, pie charts, and box and whisker plots.
Code in the Python 3.5 programming language.
Make games with Python.
Create and manipulate dataframes with pandas.
Read and write data from and to CSV.
Recognize analytical approaches to data, including: analyzing data, locating, making statistical descriptions and plots of data.
Create basic line and scatter plots with Matplotlib 1.5.
Read finance data from Yahoo.
Customise graphs with visuals, a title, labels, text and a legend.
Understand figures and subplots.
Understand basic 3D plotting.
You should take this course!
Who this course is for:
Absolute beginners who want to learn to code in the popular Python programming language.
Beginners who want to learn how to use data science to make graphs.
Intermediates who want to expand their skillset by learning pandas and Matplotlib
Intermediates who want a refresher on the fundamentals
Coding to analyze and visualize data: a class of examples