Data Visualizations using R with Data Processing

Data Visualizations using R with Data Processing
.MP4 | Video: 1280x720, 30 fps(r) | Audio: AAC, 44100 Hz, 2ch | 941 MB
Duration: 1.5 hours | Genre: eLearning | Language: English
Data Visualizations with R
.MP4 | Video: 1280x720, 30 fps(r) | Audio: AAC, 44100 Hz, 2ch | 941 MB
Duration: 1.5 hours | Genre: eLearning | Language: English
Data Visualizations with R
What you'll learn
Data Visualizations using R
Requirements
Fundamentals R programming
Description
This is the bite size course to learn R Programming for Data visualizations. In CRISP DM data mining process, Data Visualization is at the Data Understanding stage. This course also covers Data processing, which is at the Data Preparation Stage.
You will need to know some R programming, and you can learn R programming from my "Create Your Calculator: Learn R Programming Basics Fast" course. You will learn R Programming for applied statistics and you will be able
You can take the course as follows, and you can take a exam at EMHAcademy to get SVBook Certified Data Miner using R certificate :
- Create Your Calculator: Learn R Programming Basics Fast (R Basics)
- Applied Statistics using R with Data Processing (Data Understanding and Data Preparation)
- Advanced Data Visualizations using R with Data Processing (Data Understanding and Data Preparation, in future)
- Machine Learning with R (Modeling and Evaluation)
Content
Getting Started
Getting STarted
Getting Started
Hello World Application
Data Mining Process
Download Dataset
Read Dataset
Bar Plot
Export Bar CHart as Image
Horizontal Bar Chart
Histogram
Histogram with Density Line
LIne Chart
Multiple Line Chart
Pie Chart
3D Pie Chart
Scatterplot
Boxplot
Scatterplot Matrix
GGPlot 2
Aesthetic Mapping and Geometric
GEometrics
Labels and Titles
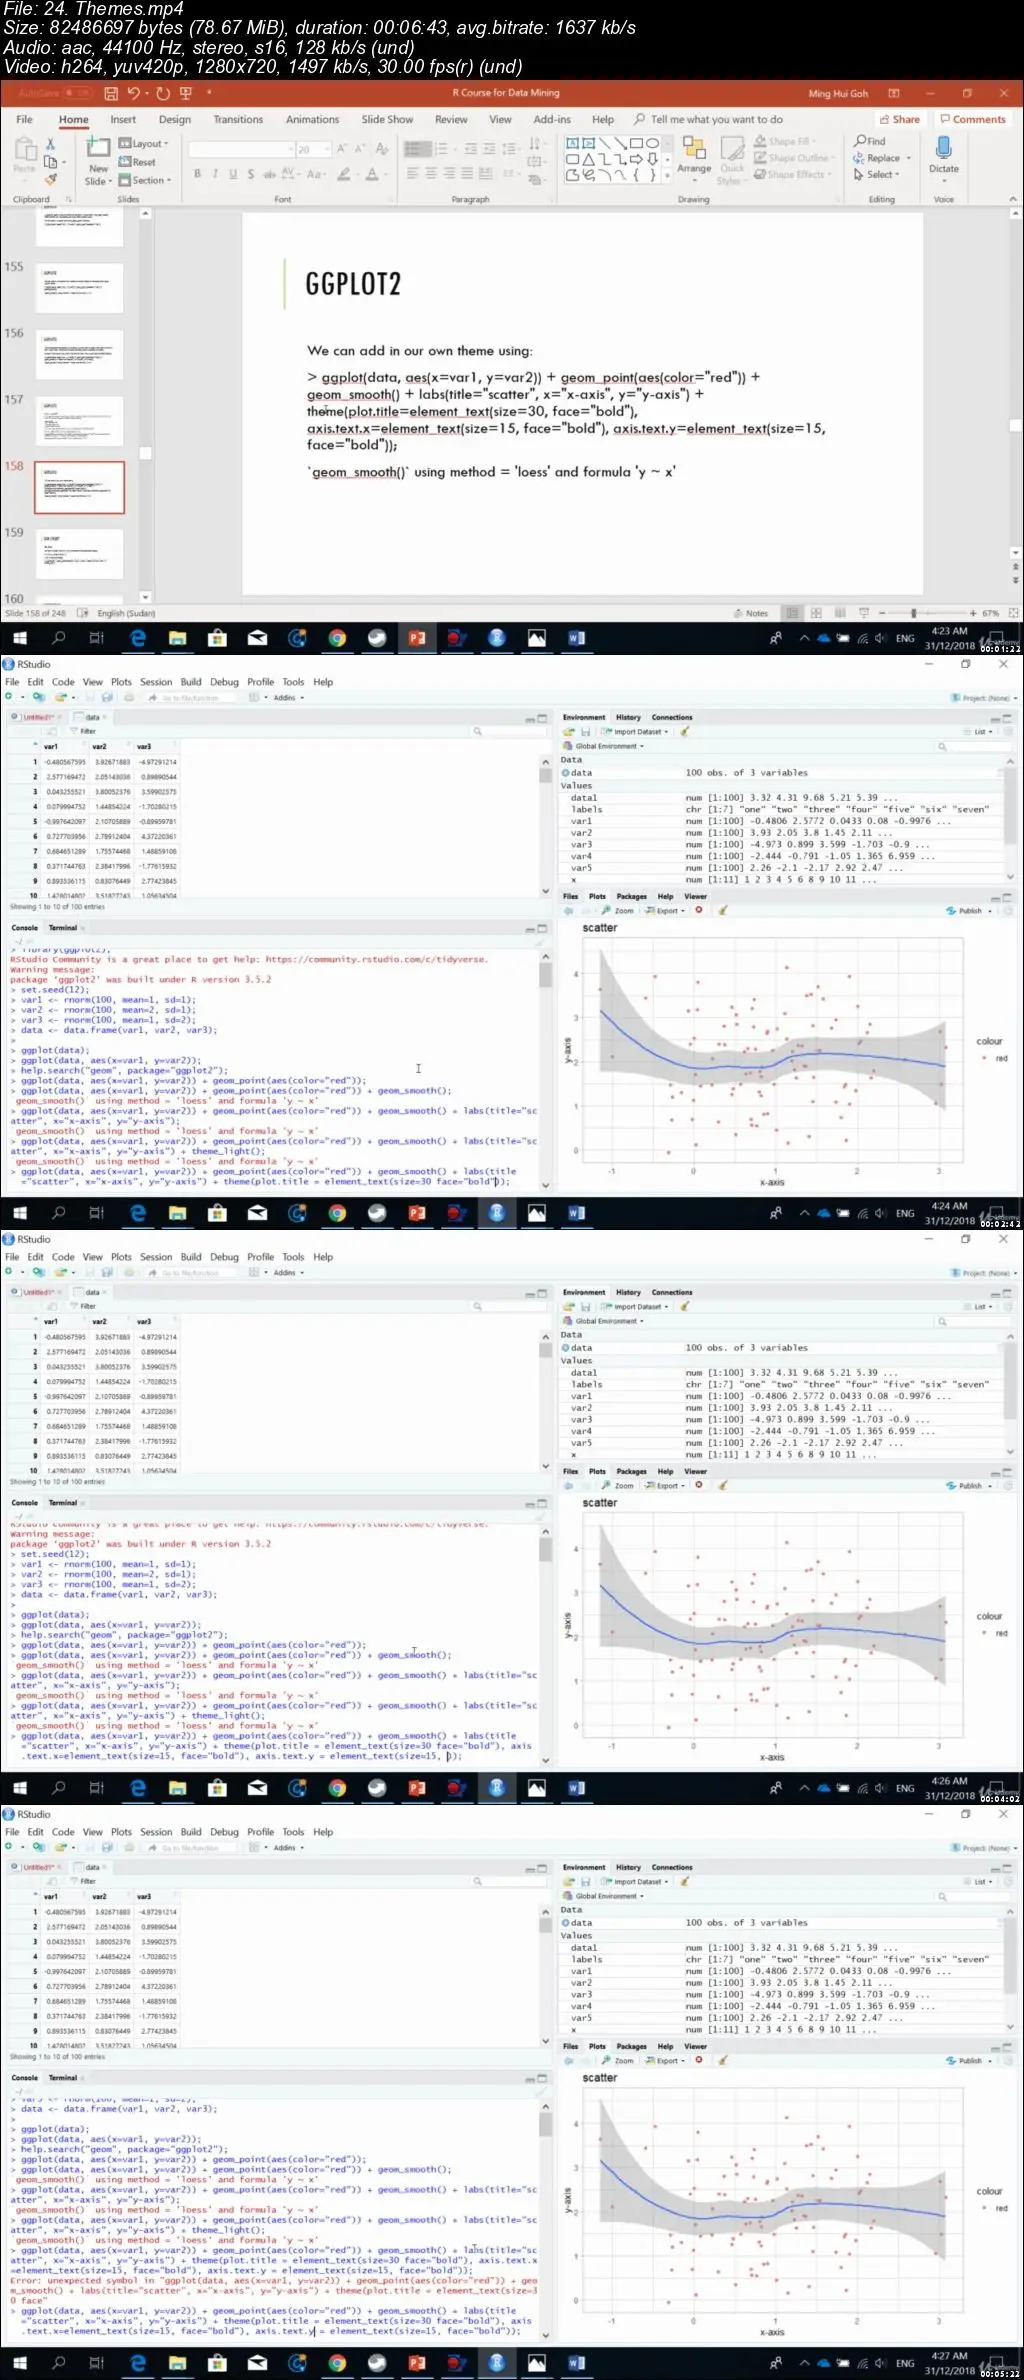
Themes
GGPlot2: Bar CHart
GGPlot2: HIstogram
GGPlot2: Density Plot
GGPlot2: Scatterplot
GGPLot2: Line Chart
GGPLot2: BoxpLot
Save GGPLot Image
Data Processing: Select Variables
Data Processing: Sort Data
Data Processing: Filter Data
Data Processing: Remove Duplicates and Missing Values
References:
This course is actually based on the Learn R for Applied Statistics book I have published at Apress.
Who this course is for:
Beginner Data Scientist or Analyst interested in R programming
Data Visualizations using R with Data Processing