Data Visualization with After Effects

Data Visualization with After Effects
Video: .mp4 (1280x720, 30 fps(r)) | Audio: aac, 48000 Hz, 2ch | Size: 398 MB
Genre: eLearning Video | Duration: 12 lectures (52 mins) | Language: English
Present your ideas with Awesome Infographic animations
Video: .mp4 (1280x720, 30 fps(r)) | Audio: aac, 48000 Hz, 2ch | Size: 398 MB
Genre: eLearning Video | Duration: 12 lectures (52 mins) | Language: English
Present your ideas with Awesome Infographic animations
What you'll learn
You will learn how to create Data Visualization and other animations in After Effects.
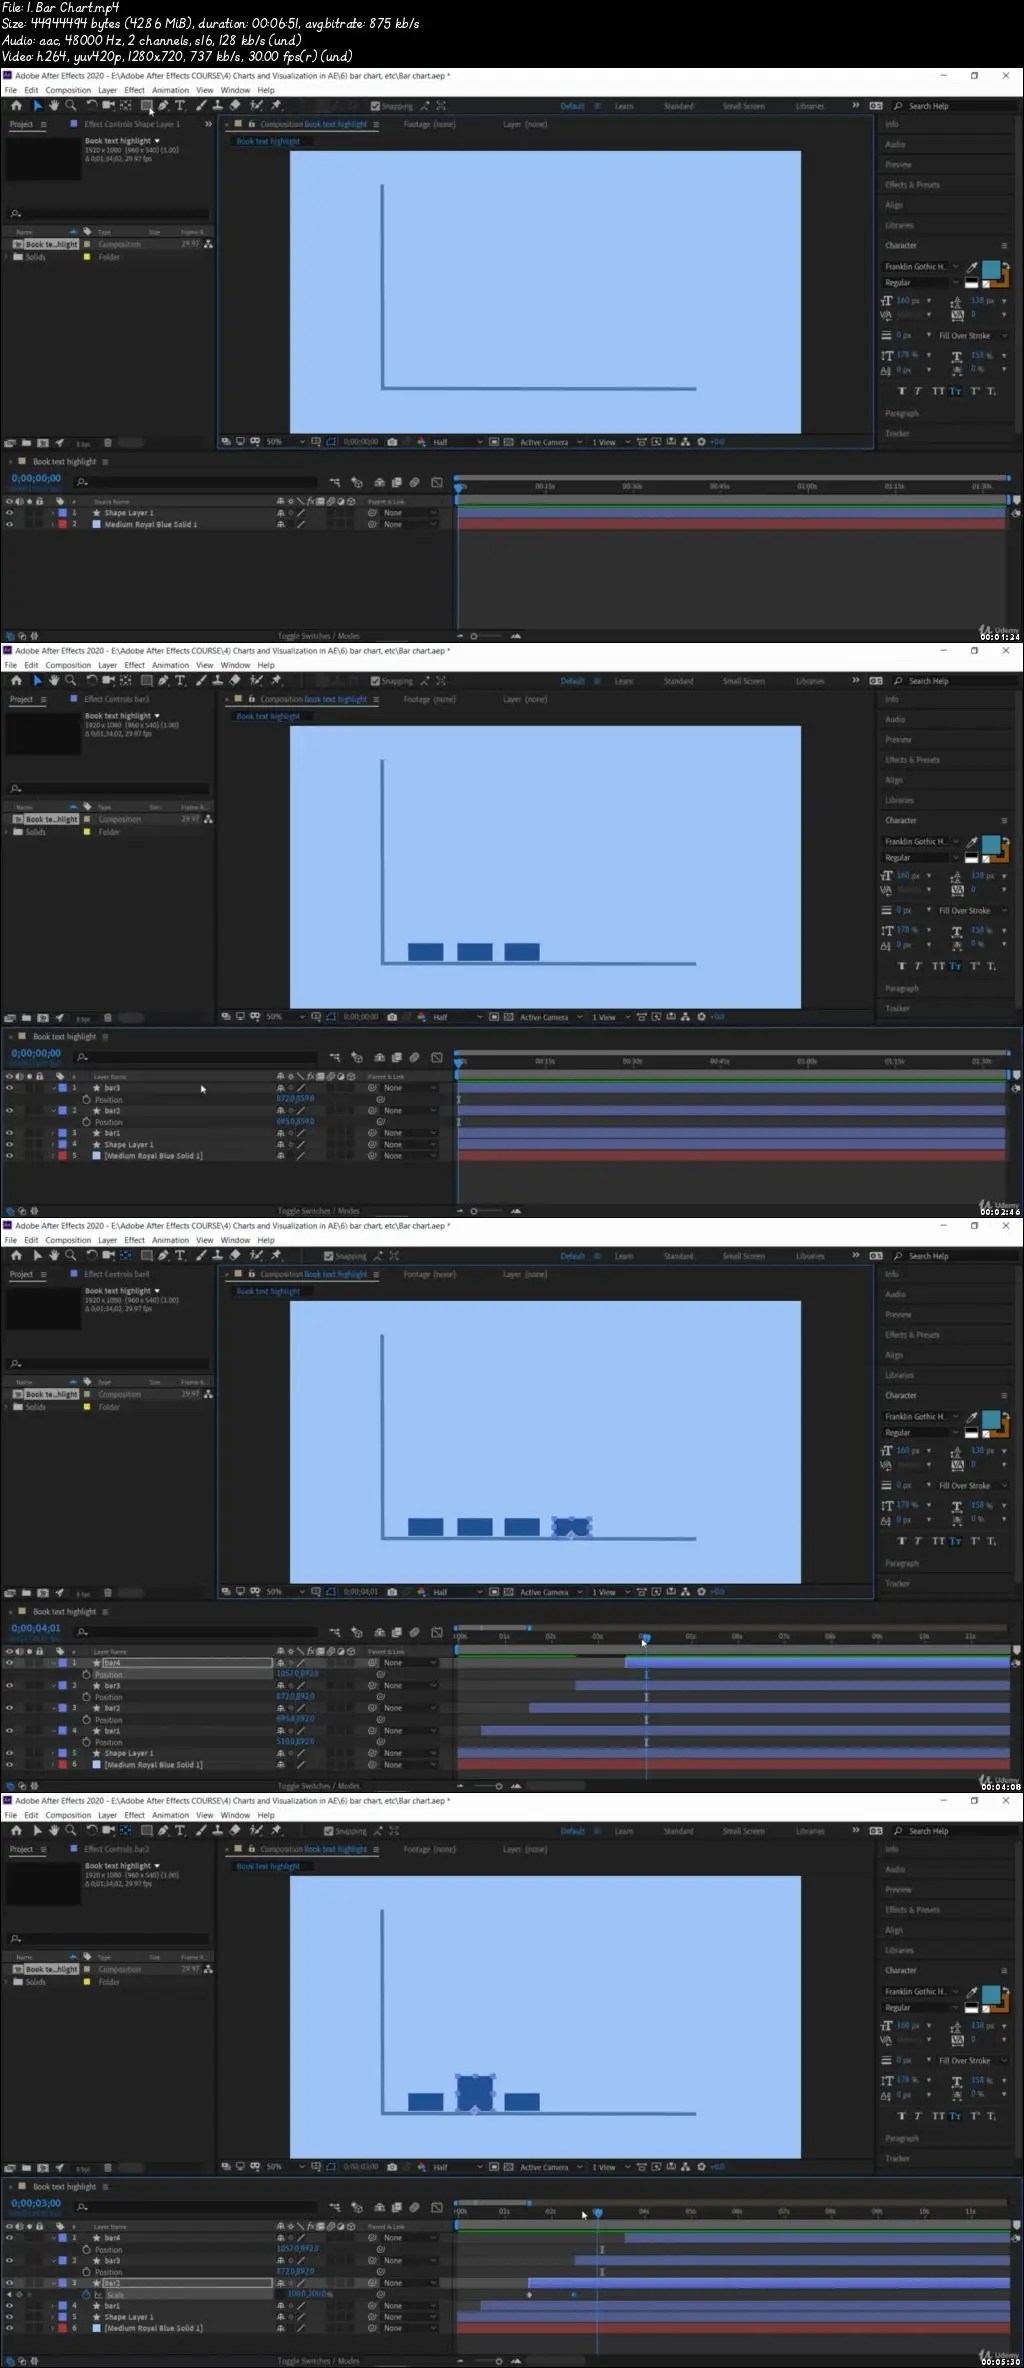
You will learn how to create Pie chart, Bar chart, Line chart, Shape Infographics and other animations.
Requirements
There is no prerequisites to take this course, but if you are already familiar with After Effects, it could be helpful.
This course is suitable for beginners as well as professionals who are interested in learning various Data Visualization animations.
Description
In this course, you will be learning about Data Visualization and Infographic Animations in After Effects from scratch. You will be learning various visualization animation techniques you can implement to build an attractive presentation or advertisement video. There are various drag and drop tools available in the market, but when you need full control over all effects with professional look and feel, you could use Adobe After Effects. In this course you will be learning various charts and other infographic animations in Adobe After Effects.
What is Data Visualization?
Data visualization is the graphical representation of data. It involves producing images or visuals that communicate relationships among the represented data to viewers, and empower the storytelling capability of the creator.
What you will be learning in this course?
With the skills learned in this course, you could create powerful Explainer and visual Animation videos or compositions, that can be used in various Visual Effects and Motion Graphics projects. You can present your idea easily and effectively to your target audience. You will be learning about creating various charts and graphs. You will also learn masking an image to the graph using track matte. After that you will learn shape fill infographics and rotating sphere background. In this course you will be learning the following animation techniques-
Pie Chart
Track Matte
Adding Transformations
Using Smart Objects
Bar Chart
Line Chart
Adding cool background
Shape Infographics
Who this course is for:
Anyone who is curious to learn Data Visualization animations with After effects.
Who would be creating content with Infographics animations or effects.
Content creators and Visual Artists who would like to present their ideas with Appealing visuals.
Data Visualization with After Effects