Data Understanding and Data Visualization with Python
Data Understanding and Data Visualization with Python
.MKV, AVC, 1920x1080, 30 fps | English, AAC, 2 Ch | 12h 16m | 5.92 GB
Created by AI Sciences OÜ
.MKV, AVC, 1920x1080, 30 fps | English, AAC, 2 Ch | 12h 16m | 5.92 GB
Created by AI Sciences OÜ
Learn data visualization from scratch
Key Features
Learn data manipulation and visualization from scratch
Master various Python libraries such as NumPy, Pandas, Matplotlib, and so on
Create interactive, insightful visualizations
What You Will Learn
Fundamentals of data manipulation and visualization
Use Pandas and NumPy for data manipulation
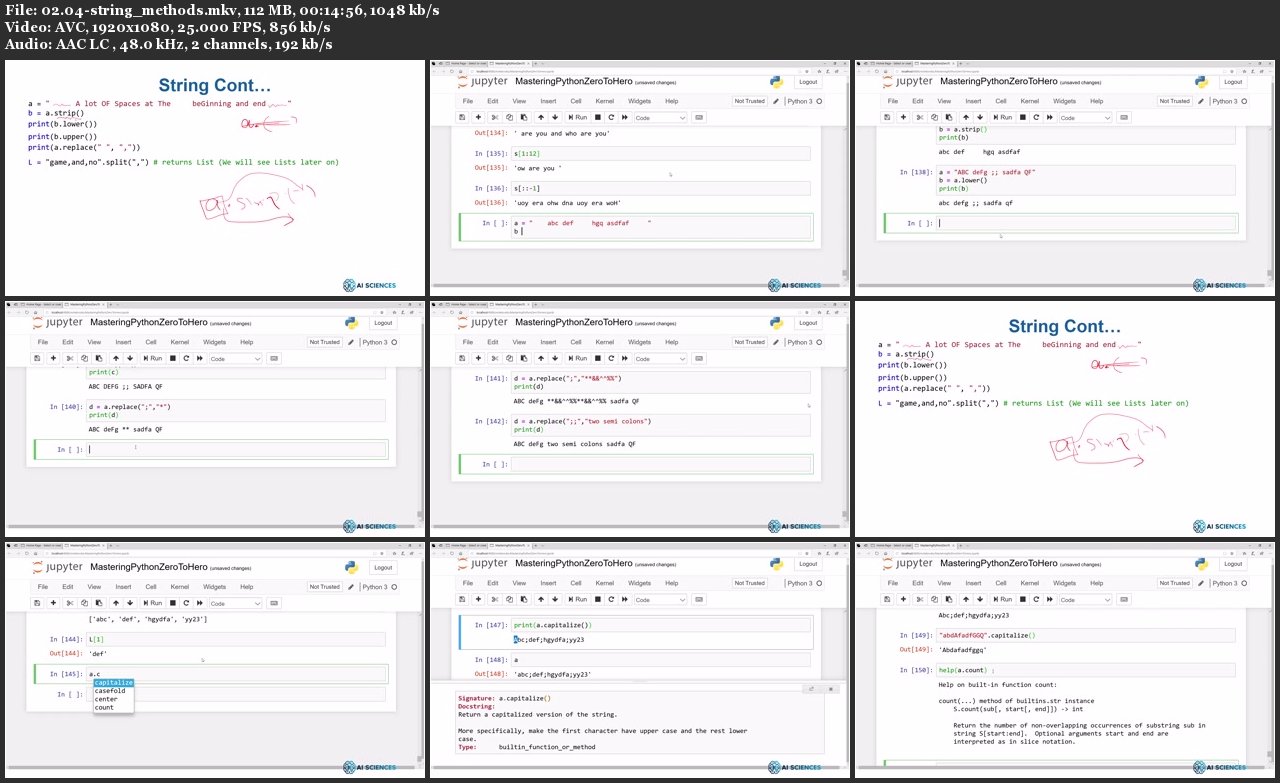
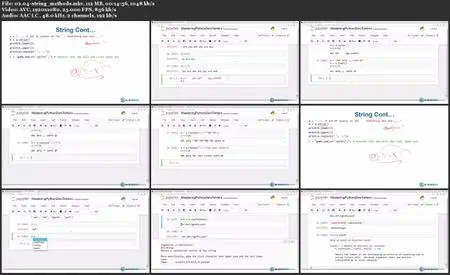
Handling text data with string
CRUD (Create, Retrieve, Update, Delete) operations on data
3D visualizations with Matplotlib and Plotly
Creating surface and scatter 3D interactive plots in Plotly
About
Data visualization has gained a lot of traction resulting from an increased focus on data analytics. To be a successful data scientist, data manipulation and wrangling is not enough. Visualizing data to garner insights is an equally important tool in the data science toolkit. Given the myriad types of data that exist, visualization has become an increasingly important topic.
This course will equip you with all the skills you need to successfully create insightful visualizations. The course first starts with the fundamentals of Python. Then, the course teaches you how to use libraries such as NumPy, Pandas, Matplotlib, Seaborn, Bokeh, and so on. Additionally, you will learn data manipulation, which is the step prior to visualization. You will also learn how to plot geographical data using Folium.
Each module in the course has practical hands-on mini projects. Hence, you not only learn the theoretical fundamentals of visualizations but also gain essential practical skills. With over 12 hours of content, this is one of the most comprehensive courses you will be doing on data visualization in Python.
The code files and all related files are uploaded on GitHub at https://github.com/PacktPublishing/Data-Understanding-and-Data-Visualization-with-Python
Data Understanding and Data Visualization with Python