Hands-on Tableau-10: Data Science Case Studies In Tableau
Hands-on Tableau-10: Data Science Case Studies In Tableau
Video: .mp4 (1280x720, 30 fps(r)) | Audio: aac, 48000 Hz, 2ch | Size: 2.15 GB
Genre: eLearning Video | Duration: 39 lectures (4 hour, 10 mins) | Language: English
Video: .mp4 (1280x720, 30 fps(r)) | Audio: aac, 48000 Hz, 2ch | Size: 2.15 GB
Genre: eLearning Video | Duration: 39 lectures (4 hour, 10 mins) | Language: English
Learn Tableau 10 practical for Data Science . Real-Life Data Visualization, Data analysis, data analytics Exercises.
What you'll learn
Data Visualization, Data analysis
Connect Tableau to various Datasets: Excel and CSV files
Create various plots
Learn to create groups
Learn to create various types of sets
Learn to create dashboard
Learn to create Storyline
Requirements
Basic knowledge of computers
Interest in data science Or tableau
Description
Learn data visualization through Tableau 10 and create opportunities for you or key decision makers to discover data patterns such as customer purchase behavior, sales trends, or production bottlenecks.
Tableau is an interactive, self-service reporting and analytics tool that enables faculty and staff to integrate and combine data from multiple sources into visualizations and be accessed in a single desktop environment using Tableau Desktop or through a shared dashboard.
In this course, we are going to provide students with knowledge of key aspects of Tableau. We are going to build 5 projects from scratch using real-world dataset, here’s a sample of the projects we will be working on:
Sales performance analysis
Earthquake and geospatial data analysis
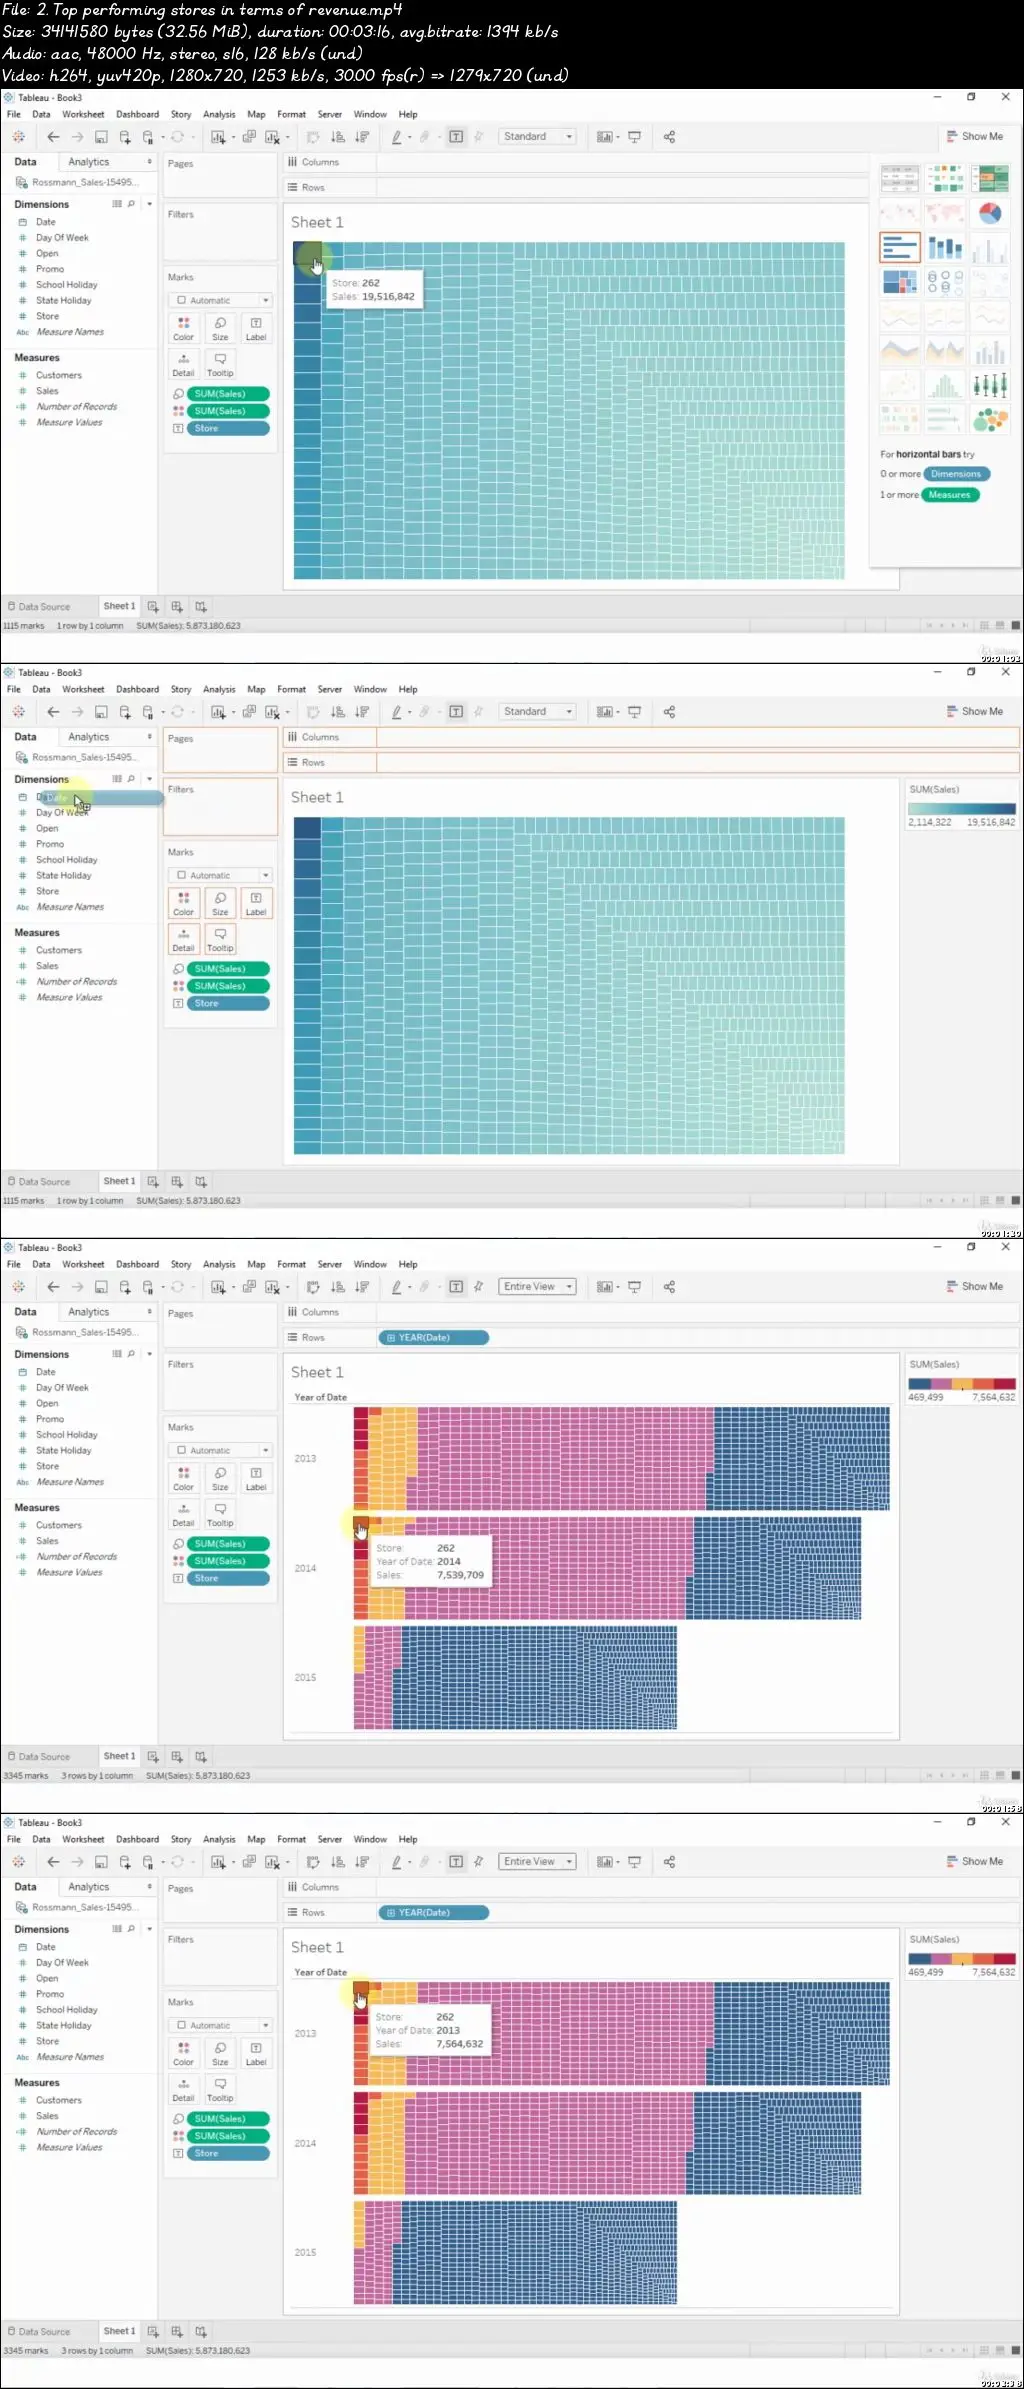
Rossman store data visualization
Top 10 Startup investment analysis
Exploratory data analysis of H1B visa data
Who this course is for:
Anyone who wants to learn Tableau
Hands-on Tableau-10: Data Science Case Studies In Tableau