


Data Analyst's Toolbox: Excel to MySQL

Data Analyst's Toolbox: Excel to MySQL
.MP4 | Video: 1280x720, 30 fps(r) | Audio: AAC, 48000 Hz, 2ch | 3.37 GB
Duration: 6.5 hours | Genre: eLearning | Language: English
.MP4 | Video: 1280x720, 30 fps(r) | Audio: AAC, 48000 Hz, 2ch | 3.37 GB
Duration: 6.5 hours | Genre: eLearning | Language: English
Learn 4 groups of skills for world-class data analysis – MS Excel, Statistics, MySQL and Power BI in one course.
What you'll learn
Get 4 groups of skills that needs each data analyst
Learn MS Excel for cleaning, preparing, calculating and analysing data
Learn Statistics by Data Analysis ToolPak including Linear regression
Learn SQL from scratch for extracting and manipulating big data by MySQL Workbench
Learn Power BI for analysing and visualizing data and creating interactive dashboards
Put all 4 groups of skills together for identifying insights and trends based on data
Requirements
Only the passion for data
MS Excel 2010, 2013, 2016, 2019
Other softwares used in this course are open sources
Description
Use Excel, Statistics, SQL, and Power BI to identify trends and drive business decisions with real‐world data.
1. MS Excel:
Unlock the power of MS Excel to utilize its analytical tools — no matter your experience level.
Execute conditional aggregation commands (SUBTOTAL, SUMIFS, COUNTIFS, etc.) to summarize data sets.
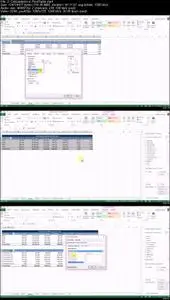
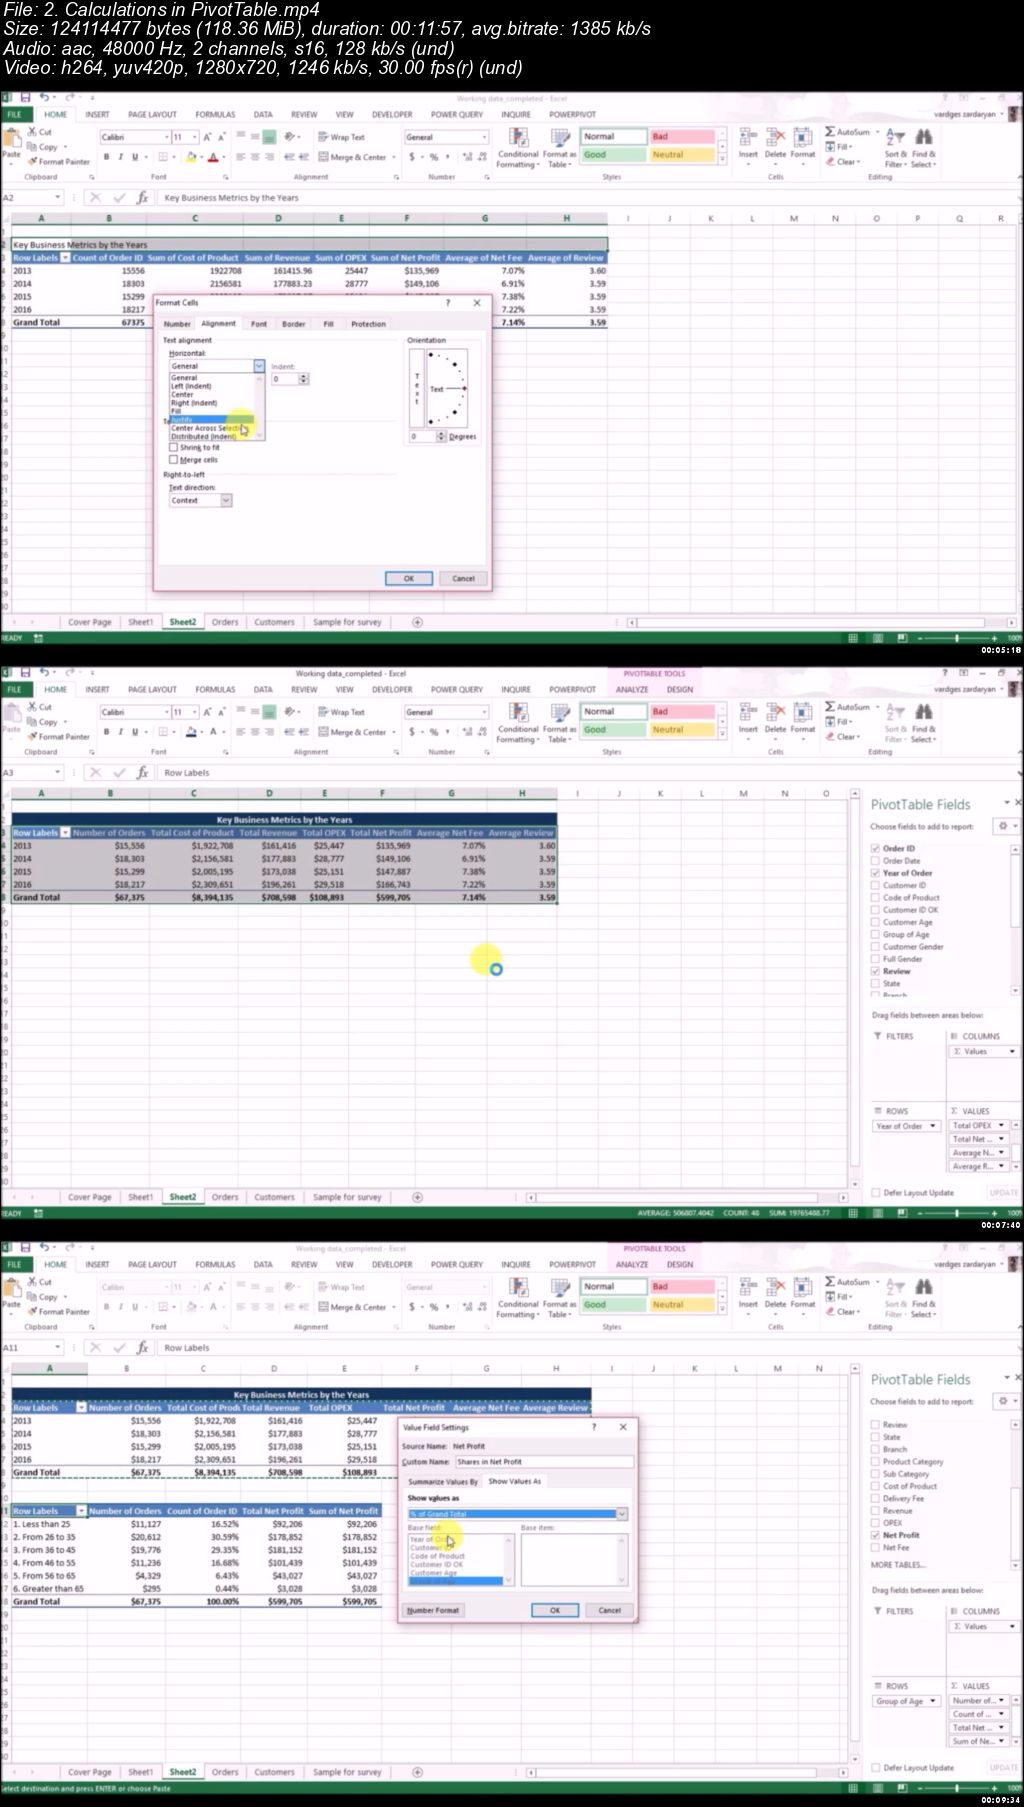
Practice applying the PivotTable tool for data analysis of a sample business case.
Use the VLOOKUP, INDEX and MATCH functions to manipulate data sets in MS Excel.
2. Statistics
Understand the value of descriptive and inferential statistics.
Learn to describe data using its mean, median, mode, range, and variance.
Practice applying statistical functions in MS Excel.
Create Linear regression Model by using Data Analysis ToolPak in MS Excel.
3. MySQL
Filter data using advanced SQL commands (Where, Group By, Having, Order By, Limit).
Obtain data by creating relationships between tables using Joins.
Summarize data sets by employing aggregation commands (“Sum,” “Average,” “Count,” etc.).
Use CASE statements to structure data and create new attributes.
4. Power BI
Get hands-on, practical experience navigating the Power BI software interface.
Connect your data to Power BI and identify the best ways to visualize and display your results.
Analyze and visualize your data in Power BI in order to answer basic questions.
Create advanced interactive dashboards for presentation.
Who this course is for:
Data Analysts, Business Analysts, Financial Analysis, Marketing Analysts
Data Analyst's Toolbox: Excel to MySQL
Bookmark My Blog & Visit it Daily for More Video Tutorial