Microsoft Excel - Data Analysis with Excel Pivot Tables
Microsoft Excel - Data Analysis with Excel Pivot Tables
.MP4, AVC, 320 kbps, 1920x1080 | English, AAC, 128 kbps, 2 Ch | 6.4 hours | 1.14 GB
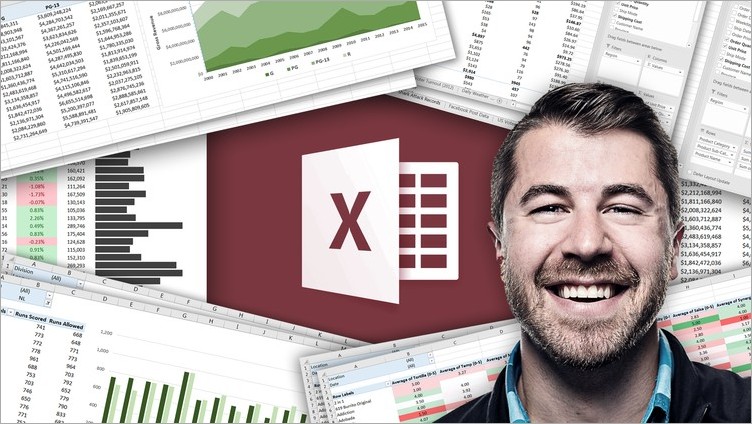
Instructor: Chris Dutton
.MP4, AVC, 320 kbps, 1920x1080 | English, AAC, 128 kbps, 2 Ch | 6.4 hours | 1.14 GB
Instructor: Chris Dutton
Master Excel PivotTables with 10 real-world case studies from a best-selling Excel instructor (Excel 2010, 2013, 2016)
Pivot Tables are an absolutely essential tool for anyone working with data in Excel.
Pivots allow you to quickly explore and analyze raw data, revealing powerful insights and trends otherwise buried in the noise. In other words, they give you answers. Whether you're exploring product sales, analyzing which marketing tactics drove the strongest conversion rates, or wondering how Boston condo prices have trended over the past 15 years, Excel Pivot Tables provide fast, accurate and intuitive solutions to even the most complicated questions.
This course gives you a deep, 100% comprehensive understanding of Excel Pivot Tables and Pivot Charts. I'll show you when, why, and how to use Pivot Tables, introduce advanced sorting, filtering, and calculation tools, and guide you through interactive, hands-on demos and exercises every step of the way.
__________
We'll start by covering everything you need to know to get up and running with Excel Pivot Tables, including:
Raw data structure
Table layouts & styles
Design & formatting options
Sorting, filtering, & grouping tools
Calculated fields, items & values
Pivot Charts, slicers & timelines
Interactive dashboards
__________
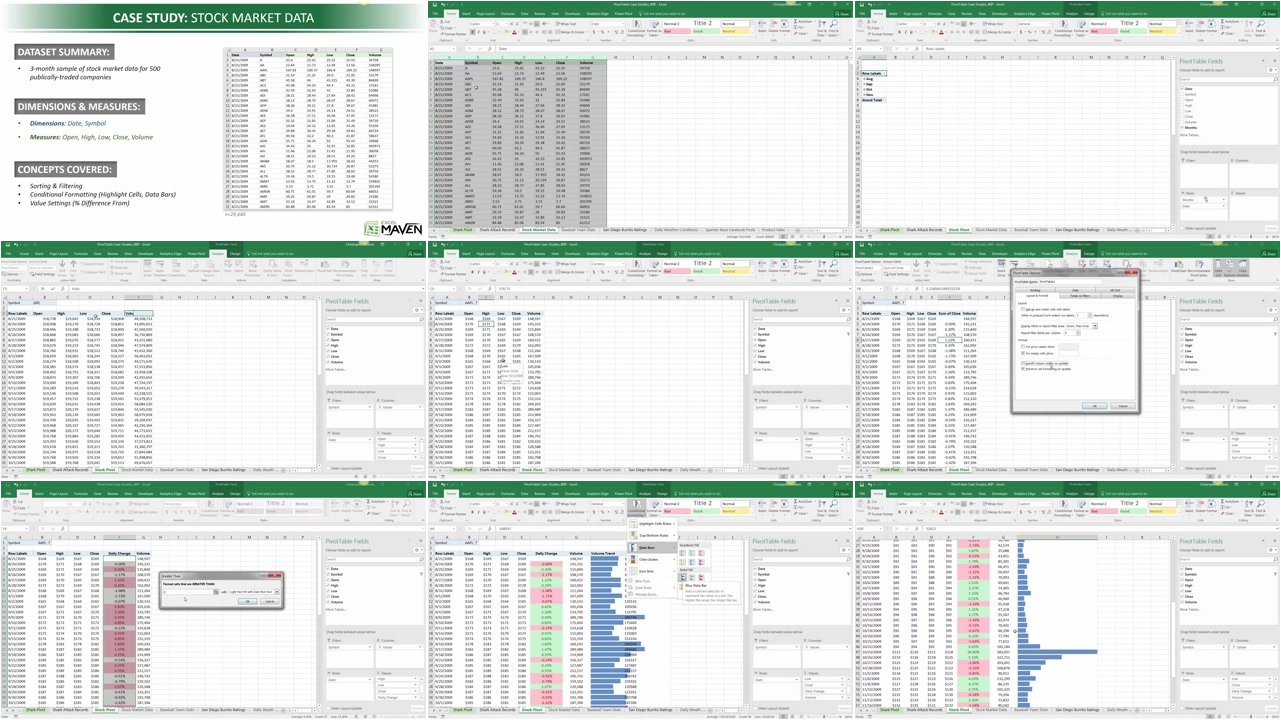
We'll then explore and analyze datasets from a number of real-world case studies, including:
San Diego burrito ratings
Shark attack records from 1900-2016
Facebook Post data from Spartan Race
Major League Baseball team statistics
San Francisco employee salaries
Daily stock market data
__________
Whether you're looking for a quick primer, trying to diversify your Excel skill set, or hoping to step up your analytics game in a major way, you've come to the right place. In today's increasingly data-driven world, analytics skills are in short supply and incredibly high demand, and those with the ability to transform data into insight are leading the charge. I'm here to help you become an analytics ROCK STAR.
__________
NOTE: Full course includes downloadable resources and project files, homework and course quizzes. Compatible with Excel 2007, Excel 2010, Excel 2013, Excel 2016, or Office 365
Who is the target audience?
ANYONE who works with Excel on a regular basis
Excel users who have basic skills but would like to become more proficient in data exploration and analysis
Students looking for a comprehensive, engaging, and highly interactive approach to training
Microsoft Excel - Data Analysis with Excel Pivot Tables