Customer Analytics in SPSS

Customer Analytics in SPSS
Duration: 2h 57m | .MP4 1280x720, 30 fps(r) | AAC, 44100 Hz, 2ch | 1.97 GB
Genre: eLearning | Language: English
Duration: 2h 57m | .MP4 1280x720, 30 fps(r) | AAC, 44100 Hz, 2ch | 1.97 GB
Genre: eLearning | Language: English
Identify your best customers and increase response rates, customer loyalty and profits
What you'll learn
Perform RFM analyses (recency, frequency, monetary value)
Perform complex market segmentations using an advanced clustering method
Generate profiles of the customers who responded to the past offers
Identify the top responding geographical areas (postal codes)
Estimate the contact probability of purchase and select the contacts with the greatest probabilities
Predict the probability of purchase for new customers
Compare campaign effectiveness (in terms of response rate)
Requirements
Basic SPSS knowledge (how to work with menus and commands, how to read an output)
Basic marketing and direct marketing notions
Description
Learn how to get insights from your customer data, understand your customers deeply and target the right customers with the right products!
The SPSS program offers a comprehensive customer analytics tool – the Direct Marketing module. With this tool you can conduct powerful analyses without being an expert in statistics and data analysis.
The everyday interactions with your customer generates a high amount of valuable data. The customer marketing analysis is the best solution to transform these data into real knowledge. The goal of this analysis is to get you a precise view of your customers, identify the most profitable groups of customers and send them the most appropriate marketing messages.
The Direct Marketing toolkit in SPSS includes six practical analysis procedures. Each of these procedures has its own section in this course.
The RFM analysis allows you to classify your customers according to the recency, frequency, and monetary value of their purchases. You can pinpoint your most valuable customers (those who buy often and spend much money), as well as adapt your strategy for each RFM customers (e.g. encourage new customers to buy more, reward good customers with discounts and prizes, re-gain old customers that stopped buying from you etc.)
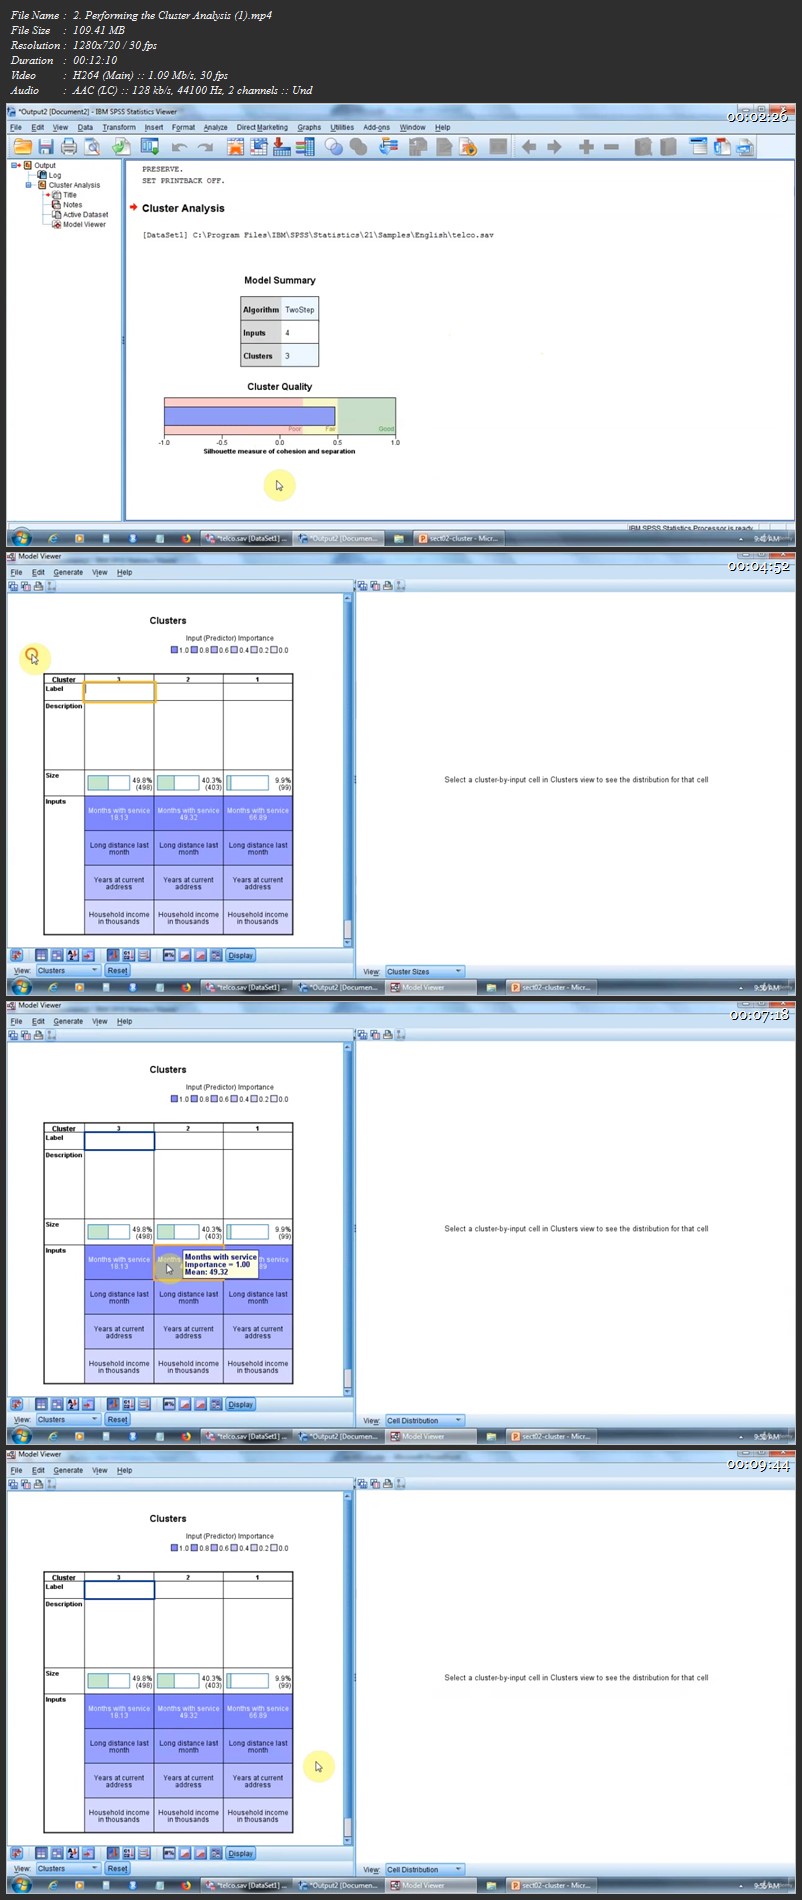
The cluster analysis procedure helps you segment your customers or prospects using their most relevant demographic, economic or behavioral characteristics. In each cluster you will find customers that are similar with eah other and different to the others. You can combine this procedure with other analyses, to identify the segments with the highest RFM values, for example, or to estimate the buying probability in each segment.
The customer profiling technique helps you detect the customer groups with the highest response rate, based on the results of previous campaign. This way you can know in advance which customers are more likely to respond to your future offers. In consequence, you can significantly improve the targeting of your future campaigns, reduce campaign costs and increase sales and ROI.
Another procedure allows you to identify the responses to your campaign by postal codes. This is extremely useful for direct mailing campaigns, because you can find out the geographical areas where most of your customers live. You can compare the response rate of each geographical zone to your target rate and decide where to send your future mailing packages so you can maximize your profits.
The Direct Marketing module in SPSS also helps you estimate the probability of purchase for each contact in your list, using an advanced prediction analysis method (binomial regression). You can send your future messages only to the prospects who are most likely to buy from you and remove the inactive prospects from your list. Moreover, you can predict the probability of purchasing for new customers, those freshly added to your list.
The Control Package Test method allows you to compare the effectiveness of two or more marketing campaigns. This is useful especially when you intend to test existing campaigns against new campaigns. The differences between the campaigns response rates are evaluated using the binomial test.
Most of the procedures above use sophisticated statistical analysis techniques to process your data. However, you don’t have to be a statistician in order to use them. You can get the results you need with a few clicks only, in a few seconds. This is what you will learn in this course.
Every procedure is explained live in SPSS, and the output is interpreted in detail. At the end of each section you can find a couple of practical exercises to strengthen your knowledge.
Who this course is for:
marketing students
marketing professionals
direct marketing professionals
marketing data analysts
customer analysts
anyone interested in learning customer analytics with SPSS
More Info
Customer Analytics in SPSS