


Master Statistical Process Control in Excel: Control Charts
Master Statistical Process Control in Excel: Control Charts
Duration: 3h 50m | .MP4 1280x720, 30 fps(r) | AAC, 44100 Hz, 2ch | 1.57 GB
Genre: eLearning | Language: English
Duration: 3h 50m | .MP4 1280x720, 30 fps(r) | AAC, 44100 Hz, 2ch | 1.57 GB
Genre: eLearning | Language: English
Using and Applying Control Charts in Industry
What you'll learn:
Statistical Process Control
how to use and interpret Control Charts
how to understand Process Variation
Six Sigma concepts and tools
Process Improvement concepts and tools
Continuous Improvement concepts and tools
how to perform statistical Data Analysis
Statistics
Data Visualizations
Requirements:
Basic Excel Skills (Formulas, Charts)
Basic knowledge of statistics (Mean, St. Dev, normal distribution)
Description:
Statistical process control and control charts are an important part of operations management. For years, these tools have been used in all kinds of industries including healthcare, manufacturing, software development finance and Human Resources. With the increasing accessibility and the increasing demand for data analysis and data-based decision making, control charting is an important tool to be able to create, understand and apply.
This course will walk through the fundamentals of what control charts are, what insights can be gathered from them and how different control charts can be used to answered different strategic and operational questions.
Each module features several lectures, downloadable lecture files and a quiz to test your learning.
Additionally, The course features an entire module tackling specific real-world cases for using control charts and statistical process control.
Topics covered include:
Module 1:
The history of statistical process control (SPC) and control charting
Parts of a control chart
Advantages of using control charts
Types of control charts (I chart, U chart, P chart, etc.)
Module 2:
Key assumptions
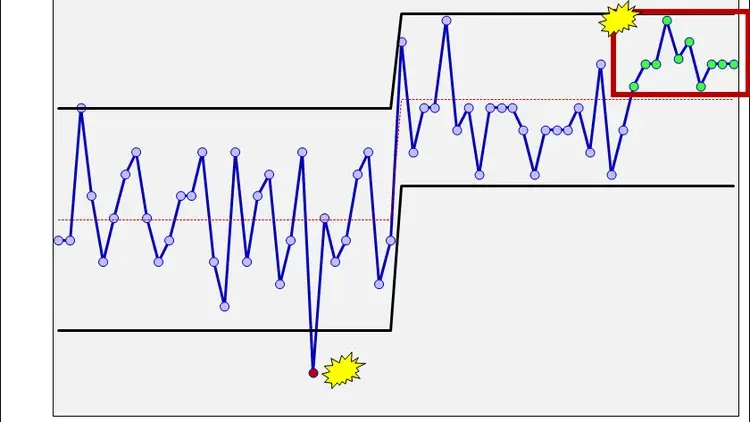
Change in mean signals
External influence signals
Change in process stability/capability signals
Module 3:
Exercises for building individual range charts
Exercises for building moving range charts
Exercises for building P charts
Exercises for building U charts
Module 4:
Applying control charts to hospital wait times
Applying control charts to manufacturing process control
Applying control charts to A/B testing in software development
Applying control charts to an inspection process
Module 5:
Control Chart Case Examples
Who this course is for:
Six Sigma Green Belt
Six Sigma Yellow Belt
Operations Managers
Process Engineers
Design Engineers
Industrial Engineers
Data Analysts
Statisticians
Quality Engineers
Quality Managers
More Info