Complete Guide to R: Wrangling, Visualizing, and Modeling Data

Complete Guide to R: Wrangling, Visualizing, and Modeling Data
.MP4, AVC, 1280x720, 30 fps | English, AAC, 2 Ch | 8h 15m | 1.35 GB
Instructor: Barton Poulson
.MP4, AVC, 1280x720, 30 fps | English, AAC, 2 Ch | 8h 15m | 1.35 GB
Instructor: Barton Poulson
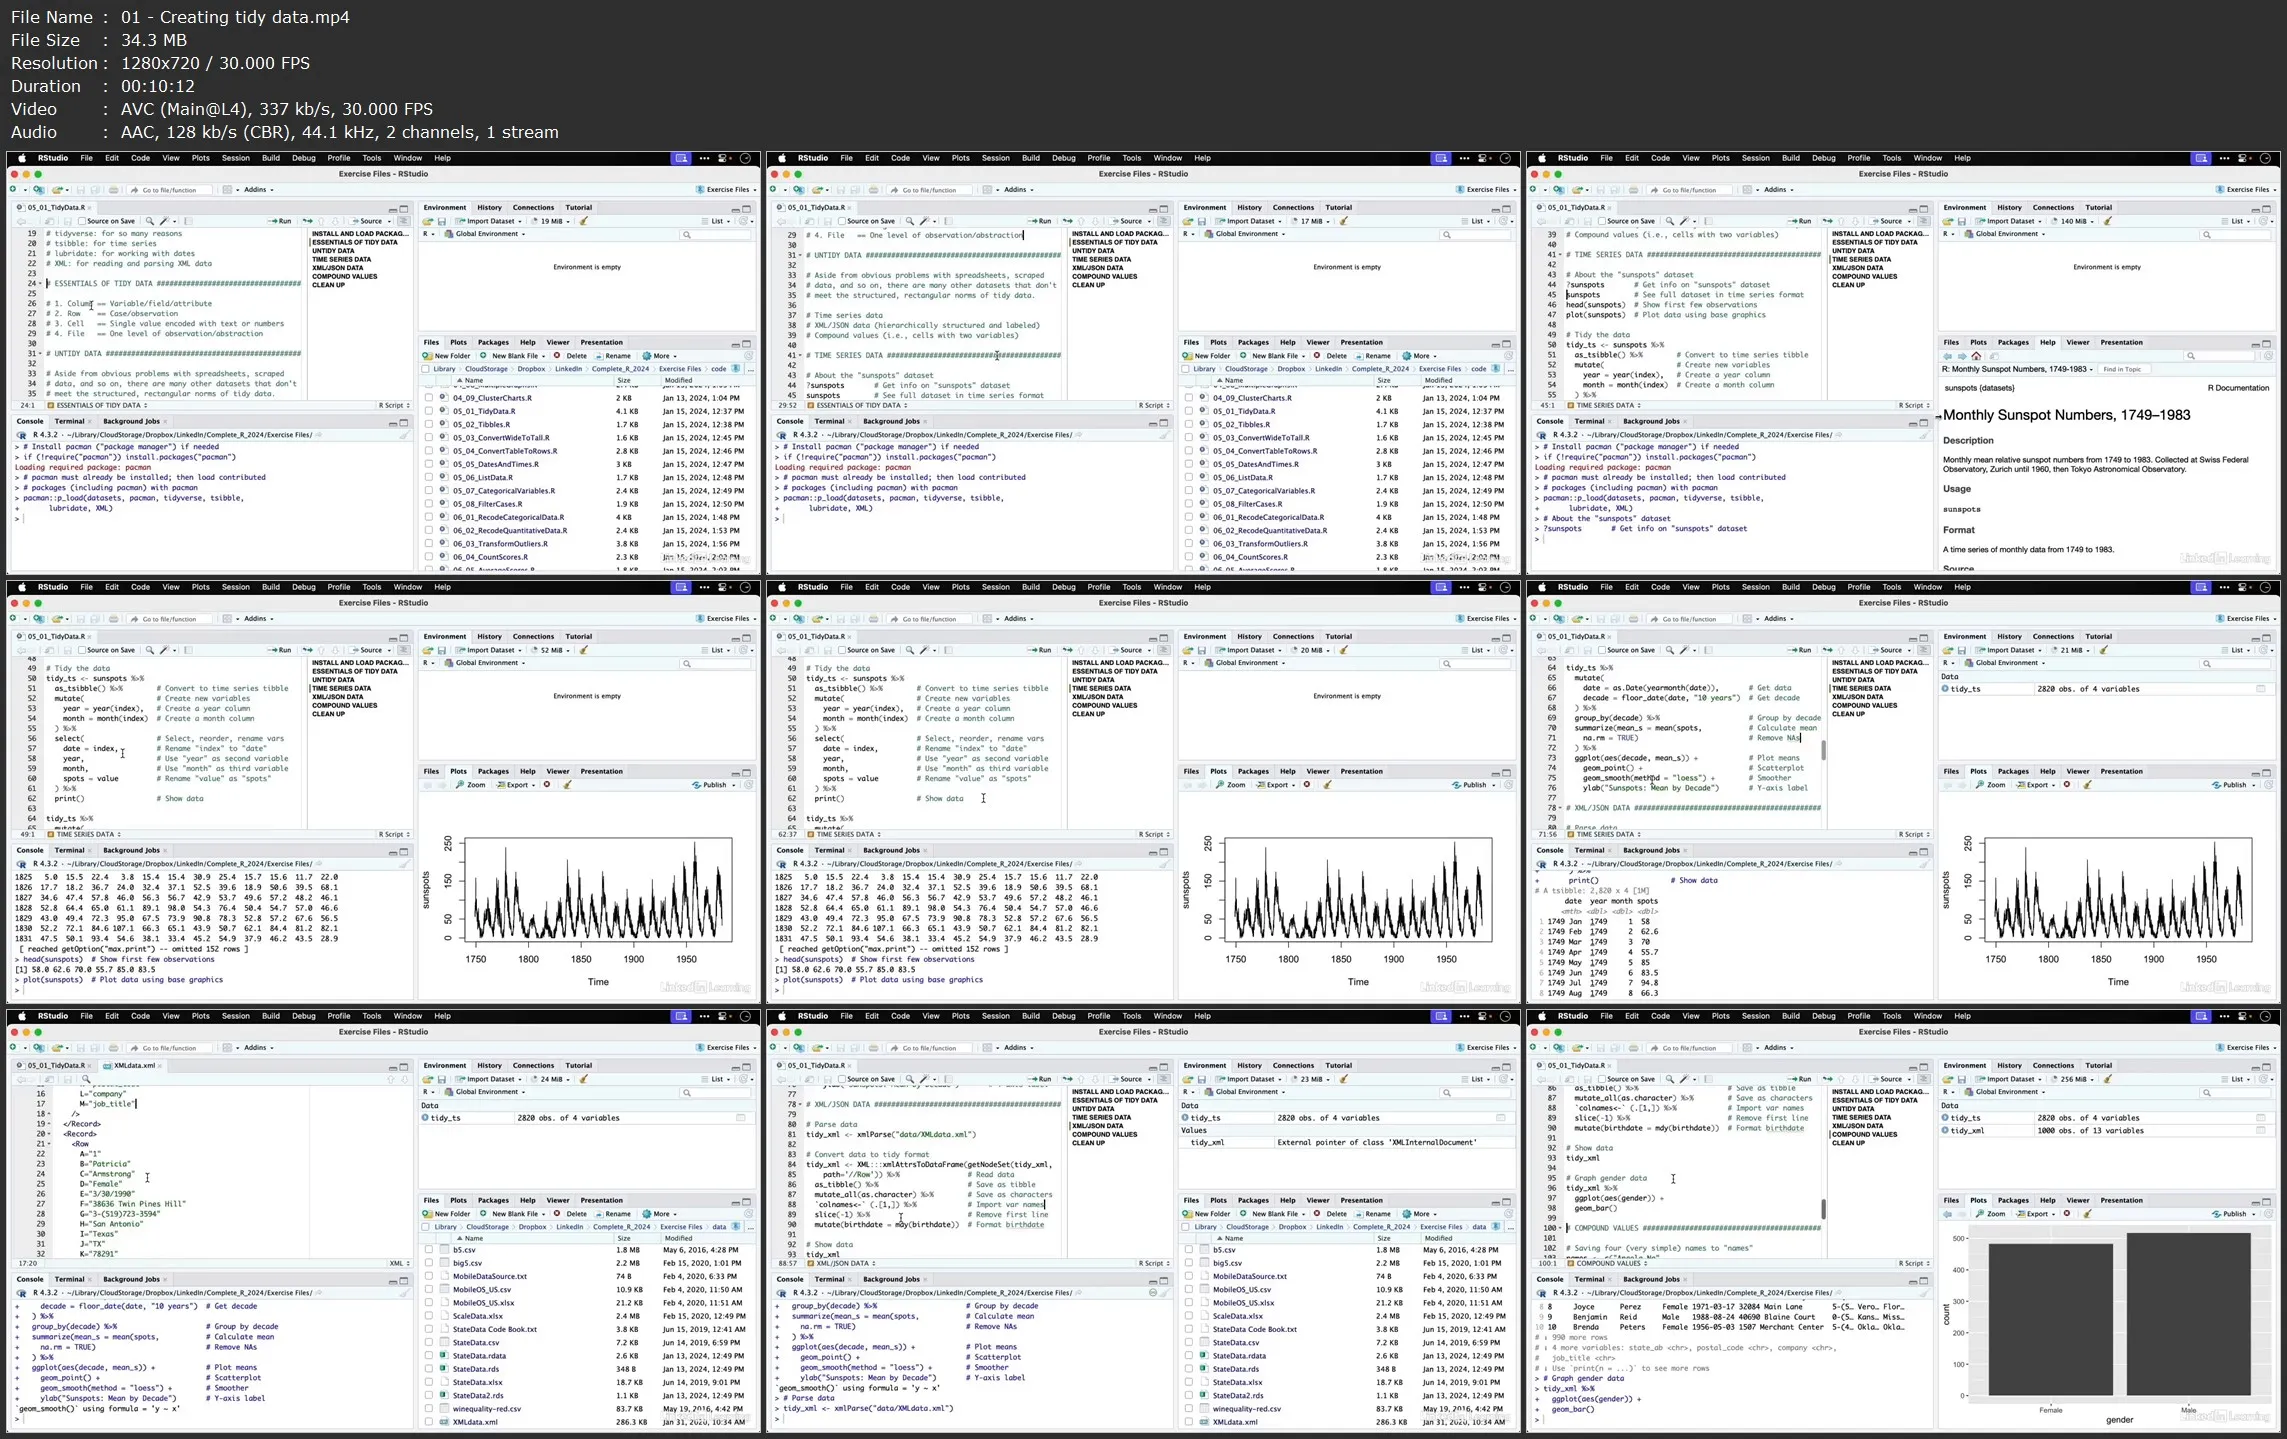
Trying to locate meaning and direction in big data is difficult. R can help you find your way. R is a statistical programming language to analyze and visualize the relationships between large amounts of data. This course with data analytics expert Barton Poulson provides a thorough introduction to R, with detailed instruction for installing and navigating R and RStudio and hands-on examples, from exploratory graphics to neural networks.
Barton shows how to get R and popular R packages up and running and start importing, cleaning, and converting data for analysis. He also shows how to create visualizations such as bar charts, histograms, and scatterplots and transform categorical, qualitative, and outlier data to best meet your research questions and the requirements of your algorithms.
Learning objectives
- Define key data types in R used for data analysis.
- Explain the process of how to import datasets into R.
- Apply basic data wrangling techniques on a dataset using tidyverse.
- Create and interpret basic statistical charts (histograms, scatter plots, box plots) using ggplot2.
- Illustrate the process of performing linear regression analysis in R.
- Generate and evaluate decision trees using R for classification tasks.
- Perform hierarchical and k-means clustering for segmenting a dataset.
- Utilize logistic regression for binary outcome prediction with categorical variables.
- Implement K-nearest neighbors (KNN) algorithm for classification tasks.
- Assess the performance of predictive models using training and testing datasets.
Complete Guide to R: Wrangling, Visualizing, and Modeling Data