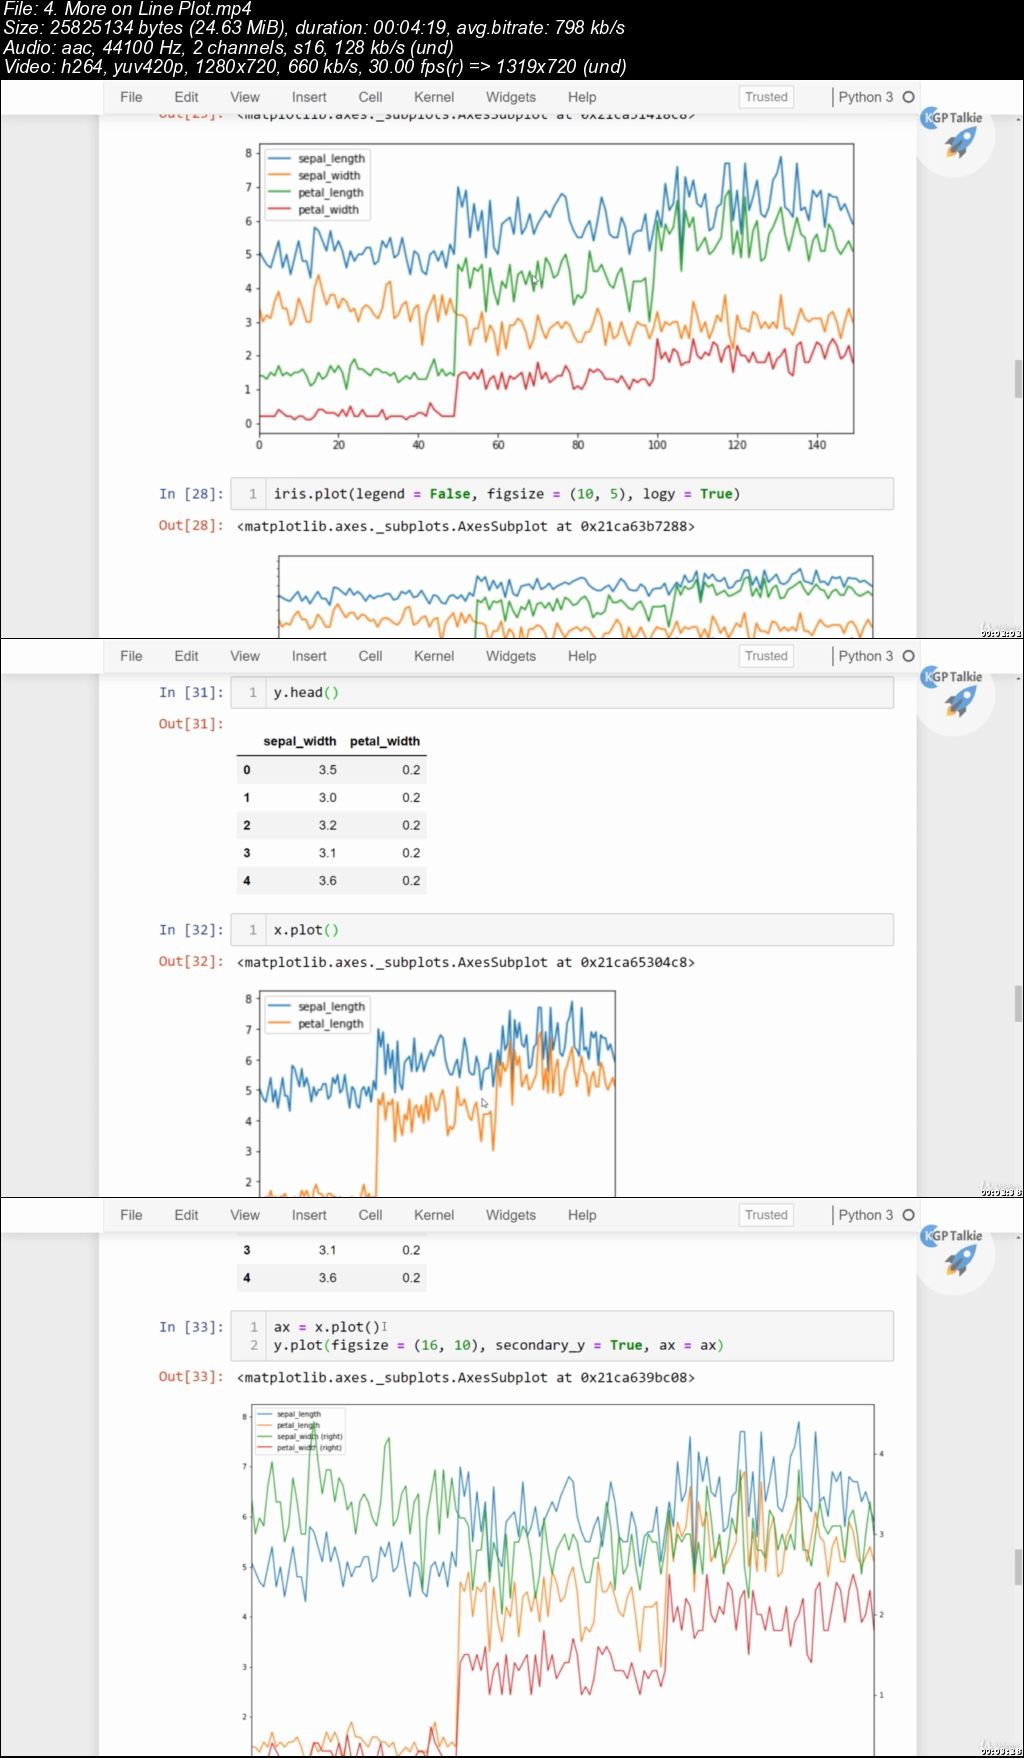
Data Visualization in Python Masterclass: Beginners to Pro
Data Visualization in Python Masterclass: Beginners to Pro
Video: .mp4 (1280x720, 30 fps(r)) | Audio: aac, 44100 Hz, 2ch | Size: 5.94 GB
Genre: eLearning Video | Duration: 208 lectures (19 hour, 57 mins) | Language: English
Video: .mp4 (1280x720, 30 fps(r)) | Audio: aac, 44100 Hz, 2ch | Size: 5.94 GB
Genre: eLearning Video | Duration: 208 lectures (19 hour, 57 mins) | Language: English
Learn NumPy, Pandas, matplotlib, Seaborn, Plotly & Cufflinks, EDA on Boston Housing, Titanic, and Covid-19 Dataset.
What you'll learn
Learn complete Exploratory Data Analysis on latest Covid-19 Dataset
Learn EDA on Kaggle's Boston Housing and Titanic Datasets
Learn IPL Cricket Matches and FIFA World Cup Matches Analysis and Visualization
Learn Data Visualization by Plotly and Cufflinks, Seaborn, matplotlib, Pandas
Learn Interactive plots and visualization
Installation of python and related libraries.
Covid-19 Data Visualization
Covid-19 Dataset Analysis and Visualization in Python
Data Science Visualization with Covid-19
Use the Numpy and Pandas in data manipulation
Learn Complete Text Data EDA
Create a variety of charts, Bar Charts, Line Charts, Stacked Charts, Pie Charts, Histograms, KDE plots, Violinplots, Boxplots, Auto Correlation plots, Scatter Plots, Heatmaps
Learn Data Analysis by Pandas.
Use the Pandas module with Python to create and structure data.
Customize graphs, modifying colors, lines, fonts, and more
Requirements
No introductory skill level of Python programming required
Have a computer (either Mac, Windows, or Linux)
Desire to learn!
Description
Are you ready to start your path to becoming a Data Scientist!
This comprehensive course will be your guide to learning how to use the power of Python to analyze data, create beautiful visualizations!
This is a very unique course where you will learn EDA on Kaggle's Boston Housing, Titanic and Latest Covid-19 Datasets with real and practical examples.
Data Scientist has been ranked the number one job on Glassdoor and the average salary of a data scientist is over $110,000 in the United States and all over the World according to Indeed! Data Science is a rewarding career that allows you to solve some of the world's most interesting problems!
This course is designed for both beginners with some programming experience or experienced developers looking to make the jump to Data Science!
This comprehensive course is comparable to other Data Science bootcamps that usually cost thousands of dollars, but now you can learn all that information at a fraction of the cost! With over 167 Full HD video lectures and detailed code notebooks for every lecture this is one of the most comprehensive courses!
We'll teach you how to program with Python, how to create amazing data visualizations with Python!
Here just a few of the topics we will be learning:
Programming with Python
NumPy with Python
Using Pandas Data Frames to solve complex tasks
Use Pandas to Files
Use matplotlib and Seaborn for data visualizations
Use Plotly and Cufflinks for interactive visualizations
Exploratory Data Analysis (EDA) of Boston Housing Dataset
Exploratory Data Analysis (EDA) of Titanic Dataset
Exploratory Data Analysis (EDA) of Latest Covid-19 Dataset
and much, much more!
By the end of this course you will:
Have an understanding of how to program in Python.
Know how to create and manipulate arrays using numpy and Python.
Know how to use pandas to create and analyze data sets.
Know how to use matplotlib and seaborn libraries to create beautiful data visualization.
Have an amazing portfolio of python data analysis skills!
Have an experience of creating visualization of real life projects
Enroll in the course and become a data scientist today!
Who this course is for:
Anyone interested in learning more about python, data science, or data visualizations.
Anyone interested in the rapidly expanding world of data science!
Developers who want to work in analytics and visualization projects.
Anyone interested in real life and practical cases data visualization
Who this course is for:
Beginners python programmers.
Beginners Data Science programmers.
Students of Data Science and Machine Learning.
Anyone interested in learning more about python, data science, or data visualizations.
Anyone interested about the rapidly expanding world of data science!
Developers who want to work in analytics and visualization project.
Anyone who wants to explore and understand data before applying machine learning.
Data Visualization in Python Masterclass: Beginners to Pro