


Colors for Data Science A-Z: Data Visualization Color Theory

Colors for Data Science A-Z: Data Visualization Color Theory
.MP4 | Video: 1280x720, 30 fps(r) | Audio: AAC, 48000 Hz, 2ch | 888 MB
Duration: 4 hours | Genre: eLearning | Language: English
.MP4 | Video: 1280x720, 30 fps(r) | Audio: AAC, 48000 Hz, 2ch | 888 MB
Duration: 4 hours | Genre: eLearning | Language: English
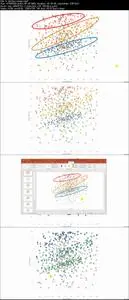
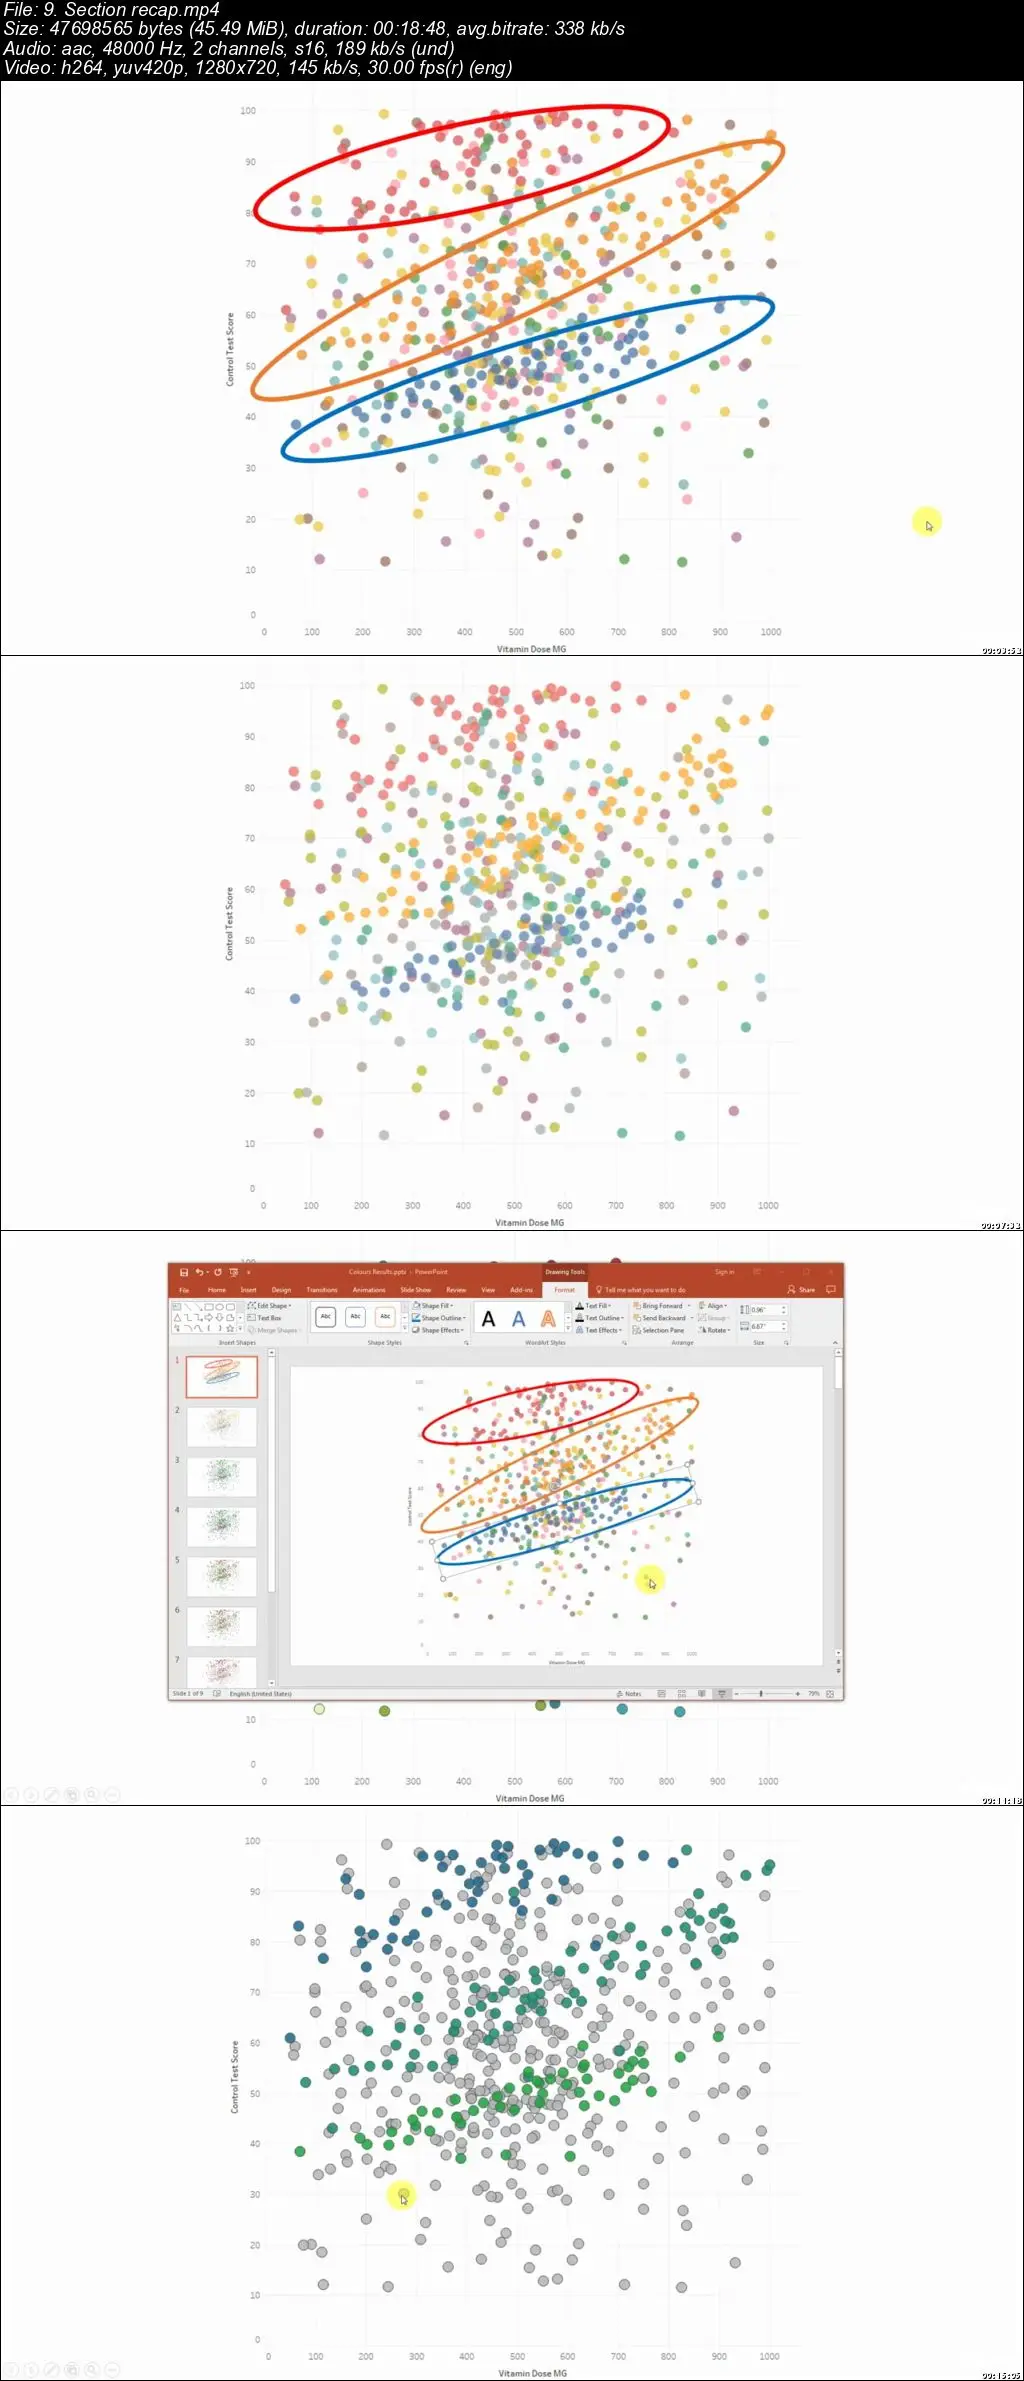
Learn how to apply colour theory to improve your Data Science & Analytics data visualisations and presentations.
What you'll learn
Use colour schemes to create eye-catching palettes
Assess colour aesthetics of any Data Visualization
Know the difference between RGB vs CMYK
Create impactful Data Science visualizations
Understand how colour schemes work
Know what a tint, shade and tone are
Know what an achromatic colour is
Use tools such as Adobe Color, Paletton and ColorBrewer
Requirements
A basic knowledge of computers and a passion to be successful
Description
A fun and entertaining journey thorough colour theory and basic colour knowledge to help you create effective Data Science visualisations.
So why is this an important course for a Data Scientist?
Think about this…
You've just completed an incredible Analytics project.
You did the data prep, the modeling, and now you have the insights.
But we all know that this is not the end…
You still need to present your findings to your manager, client or even a large audience.
Now this is where the trick is.
A powerful visualization can make or break your project.
And this is where the power of colours comes in!
In this course we will show you where colours originate from and what they mean.
You will finally understand how to make your Data Science visualizations and presentations super-impactful.
Whether you are a beginner or a seasoned Data Scientist, this course will help you truly wow your audience and take your Analytics skills to the next level.
We can't wait to see you inside!
Kirill & Patrycja
Who this course is for:
Anybody who wants to improve their data science presentation skills
Colors for Data Science A-Z: Data Visualization Color Theory
Bookmark My Blog & Visit it Daily for More Video Tutorial