Business Data Analytics with Python

Business Data Analytics with Python
.MP4, AVC, 1280x720, 15 fps | English, AAC, 2 Ch | 3h 26m | 1.61 GB
Instructor: Walter R. Paczkowski
.MP4, AVC, 1280x720, 15 fps | English, AAC, 2 Ch | 3h 26m | 1.61 GB
Instructor: Walter R. Paczkowski
Many business analysts believe that the only way to analyze data is by creating simple charts and estimating simple linear models. However, to truly extract the key information buried inside your business data—information that is important for making sound and reasonable business decisions—you need to perform sophisticated, high-powered analyses.
In this three-hour hands-on course, expert Walter Paczkowski walks you through data visualization and statistical methods implemented in Python for analyzing business data, whether sales, personnel, logistics, marketing, or financial. You'll explore the nature of business data, the application and interpretation of statistical and machine learning methods for gaining insight into your business, and how to present conclusions in tabular and graphical formats. By the end of the course, you'll be able to use Python to interactively visualize data, estimate predictive models, and distribute reports from Jupyter notebooks.
What you’ll learn and how you can apply it
By the end of this course, you’ll understand:
- How to use Jupyter notebooks to manage an analytical assignment
- How to use several Python packages for business analysis, including pandas for data manipulation; StatsModels, SciPy, and scikit-learn for modeling; and Seaborn for visualization
- How to import different data formats (CSV, Excel, etc.) into pandas
- How to divide data into training and test datasets for validation
- How to visualize business data
- How to estimate and interpret statistical models, such as OLS and logistic regression
- How to cross-validate model estimations
- How to export Jupyter notebooks to the HTML and PDF formats for sharing
And you’ll be able to:
- Take a new business dataset and analyze it for key insights using the Python packages
- Visualize business data for key insights, such as relationships, trends, patterns, and anomalies
- You're a business analyst responsible for conducting, analyzing, and interpreting data for key business decisions, and you want to learn how to use Python and its main packages.
- You want to expand your knowledge of and experience with toolsets for analytical methods, such as machine learning, and software so you can provide the best insights to your clients and advance your career.
Prerequisites
- A basic understanding of statistics and regression analysis
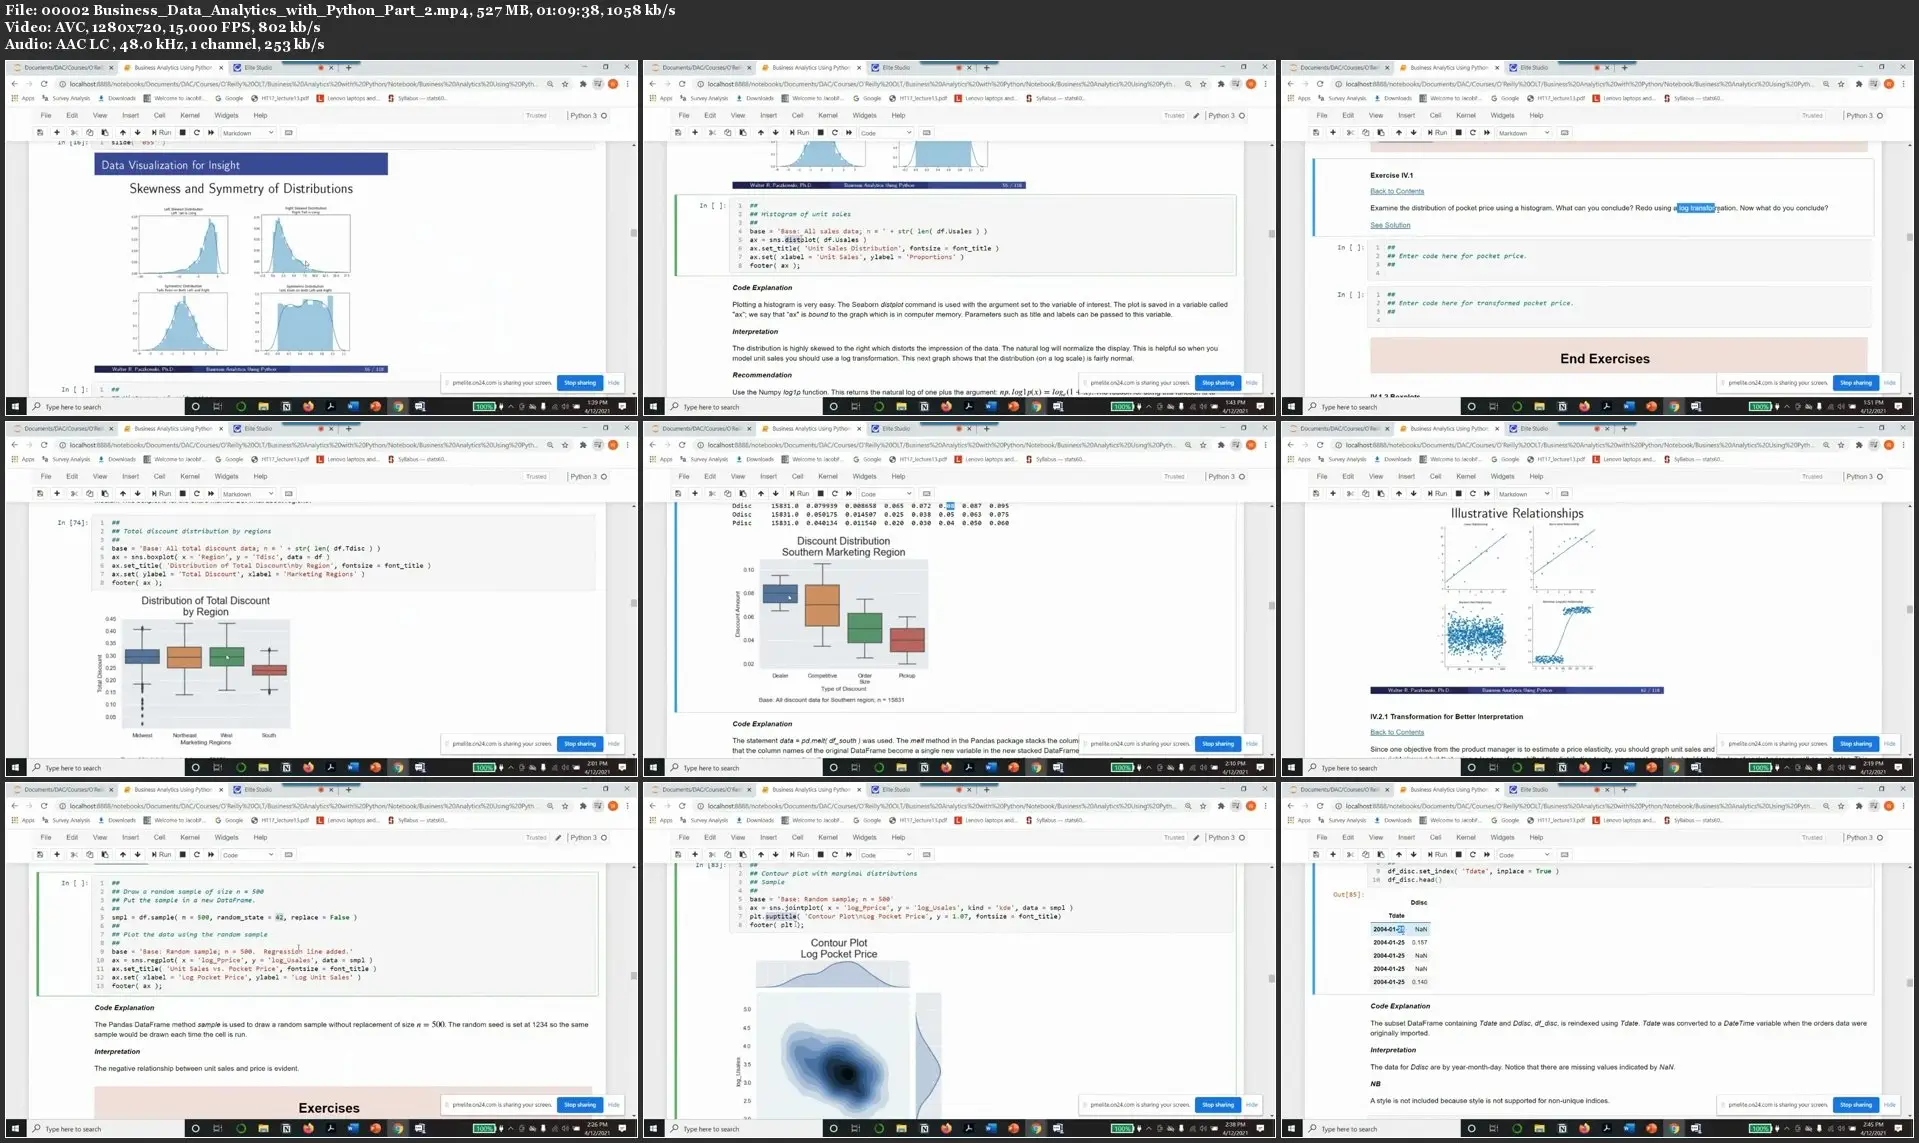
- The ability to interpret basic data visualization tools such as box plots, histograms, and scatter plots
- Experience working with business datasets
- Familiarity with business problems and functional areas such as marketing, sales, and finance
Business Data Analytics with Python