

Tabtrainer Minitab: Control Charts for Continuous Data
Tabtrainer Minitab: Control Charts for Continuous Data
Published 4/2025
Duration: 1h 11m | .MP4 1280x720, 30 fps(r) | AAC, 44100 Hz, 2ch | 582 MB
Genre: eLearning | Language: English
Published 4/2025
Duration: 1h 11m | .MP4 1280x720, 30 fps(r) | AAC, 44100 Hz, 2ch | 582 MB
Genre: eLearning | Language: English
Achieve top-level expertise in Minitab with Prof. Dr. Murat Mola, recognized as Germany's Professor of the Year 2023.
What you'll learn
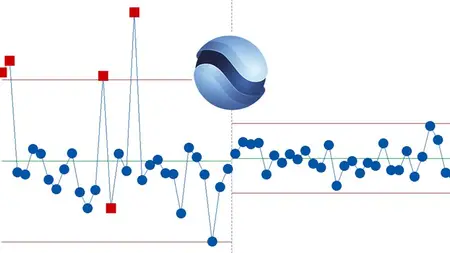
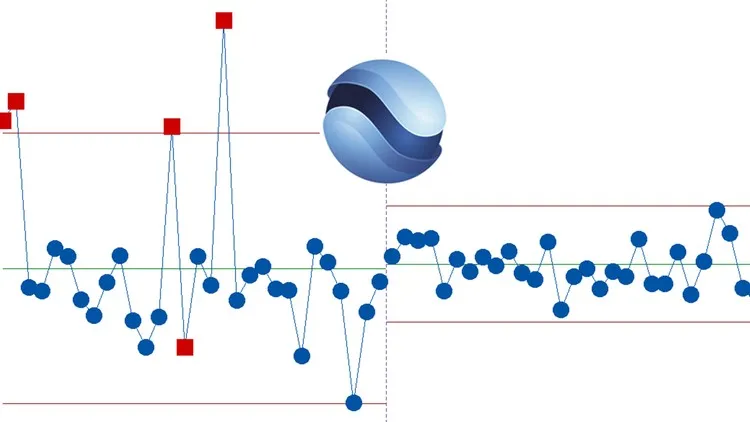
- Participants understand how control charts monitor continuous process data over time and help detect deviations from expected process behavior.
- They learn to assess process stability using Xbar and S charts in line with the AIAG standard and interpret process behavior based on subgroup trends.
- They can distinguish between process stability and capability, recognizing that stability is essential before performing a capability analysis.
- Participants understand why control limits are set at ±3 standard deviations and how this relates to the concept of zero-defect manufacturing.
- They can apply the 8 AIAG control tests to detect systematic process issues and recognize when a process is statistically out of control.
- They learn to generate Xbar and S control charts in Minitab, including correct data selection, subgroup settings, and control test activation.
- They can analyze variation within and between subgroups, using R or S charts depending on subgroup size and standard deviation behavior.
- They make data-driven decisions on process interventions based on actual signs of instability, avoiding unnecessary actions and downtime.
- Participants identify critical trends and avoid misinterpretation of random patterns as instability, improving reliability in process evaluation.
- They apply SPC principles to a real production case involving die-cast skateboard axles, reinforcing their understanding through hands-on data.
Requirements
- No Specific Prior Knowledge Needed: all topics are explained in a practical step-by-step manner.
Description
This course offers a fully certified, science-based training in Statistical Process Control (SPC) with Minitab, enabling professionals to master all relevant control chart methods from foundational theory to advanced industrial application—aligned with international standards such as AIAG and ISO, based on a realistic manufacturing scenario: the die casting of skateboard axles. Participants will not only learn the practical use of control charts such as Xbar, S, R, I, and M-R, but also gain a deeper understanding of the statistical logic behind them. The training begins with an exploration of descriptive statistics to characterize process data, followed by a detailed explanation of how control limits are calculated using real and target process parameters. Participants will apply the eight standard AIAG control tests to identify hidden patterns, trends, and anomalies that indicate potential process instabilities.
Through a step-by-step analysis of real measurement data collected over a seven-day production period, the course demonstrates how to evaluate process behavior both within and between subgroups, how to split data sets for machine-specific evaluation, and how to assess the effects of technical optimization measures. The transition from grouped data to individual observations is also addressed, enabling participants to evaluate production processes even when sampling is limited.
This training empowers professionals to make statistically sound decisions, avoid costly misinterpretations, and establish a stable basis for future capability analyses. Ideal for quality engineers, Six Sigma practitioners, and process analysts who wish to elevate their SPC knowledge to an expert level through applied learning.
Who this course is for:
- Quality Assurance Professionals: Those responsible for monitoring production processes and ensuring product quality will gain practical tools for defect analysis.
- Production Managers: Managers overseeing manufacturing operations will benefit from learning how to identify and address quality issues effectively.
- Six Sigma Practitioners: Professionals looking to enhance their expertise in statistical tools for process optimization and decision-making.
- Engineers and Analysts: Individuals in manufacturing or technical roles seeking to apply statistical methods to real-world challenges in production.
- Business Decision-Makers: Executives and leaders aiming to balance quality, cost, and efficiency in production through data-driven insights and strategies.
More Info