

Tableau For Data Science

Tableau For Data Science
2025-08-17
MP4 | Video: h264, 1920x1080 | Audio: AAC, 44.1 KHz
Language: English (US) | Size: 3.61 GB | Duration: 7h 23m
2025-08-17
MP4 | Video: h264, 1920x1080 | Audio: AAC, 44.1 KHz
Language: English (US) | Size: 3.61 GB | Duration: 7h 23m
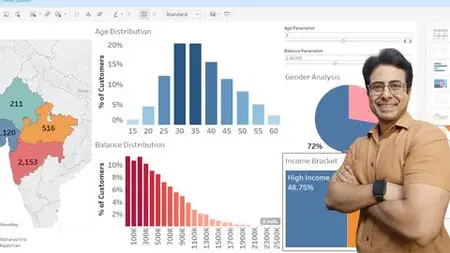
Learn Tableau Public, create dashboards, apply segmentation, and turn data into compelling stories
What you'll learn
Assign geographic roles to fields in Tableau to build interactive map-based visualizations.
Use table calculations to convert raw counts into percentages and uncover customer distribution trends.
Create and apply bins in Tableau to group continuous variables like Age and Balance into meaningful categories.
Build dynamic dashboards with filters, parameters, and layout controls to explore segmented data.
Analyze customer data by demographics such as gender, income, and region to draw actionable insights.
Turn dashboards into executive-ready storylines using Tableau’s storytelling feature and annotations.
Work entirely within Tableau Public to build professional-grade dashboards without a paid license.
Requirements
A computer with an internet connection is required.
No prior experience with Tableau is needed
A basic familiarity with Excel or spreadsheets will be helpful but not mandatory.
A willingness to explore data and follow along with hands-on practice.
Description
If you’ve been wanting to learn Tableau but felt held back by the cost of a paid license, this course is your perfect starting point. Designed entirely using Tableau Public, this hands-on course lets you master professional data visualization without spending anything on software.Whether you're a beginner or looking to sharpen your data analysis skills, this course guides you through the fundamentals and beyond. You’ll work with a clean, structured dataset from a fictional Indian bank to learn how to segment customers by gender, region, income, and age. Along the way, you’ll build interactive dashboards, apply table calculations, and master parameters to make your dashboards dynamic and insightful.But we won’t stop at charts. You’ll also learn how to present data insights effectively by turning dashboards into compelling, executive-level stories using Tableau’s built-in storytelling tools.What you'll learnAssign geographic roles to create interactive mapsCreate age and balance bins for segmentationApply filters, labels, annotations, and tooltipsDesign dashboard layouts with formatting and interactivityPerform real-time segmentation with user-driven controlsBy the end of the course, you'll have the confidence to build powerful, insight-driven dashboards that communicate clearly even when using only Tableau Public.This course is regularly updated. As a student, you'll receive lifetime access to all future content at no extra cost.
Who this course is for:
Aspiring data analysts, business intelligence professionals, or domain experts who want to master Tableau from the ground up through hands on projects, Professionals looking to transition into data-driven roles and need strong dashboarding and storytelling skills using Tableau, Students and early-career professionals preparing for interviews or roles that demand proficiency in Tableau and business data interpretation, Self-learners who want to explore Tableau’s full potential using real-world datasets — without needing access to the paid version, Product managers, marketers, and business professionals seeking to segment customer data, visualize KPIs, and derive insights through interactive dashboards, Educators or trainers looking for a realistic, structured approach to teach Tableau concepts using visual storytelling, Professionals in finance, sales, operations, or HR who want to upskill with Tableau for data-backed decision-making

Tableau For Data Science
