


Qgis: Wildfires Prevention Measuring Vegetable Activity
Qgis: Wildfires Prevention Measuring Vegetable Activity
Published 9/2022
MP4 | Video: h264, 1280x720 | Audio: AAC, 44.1 KHz
Language: English | Size: 1.97 GB | Duration: 3h 7m
Published 9/2022
MP4 | Video: h264, 1280x720 | Audio: AAC, 44.1 KHz
Language: English | Size: 1.97 GB | Duration: 3h 7m
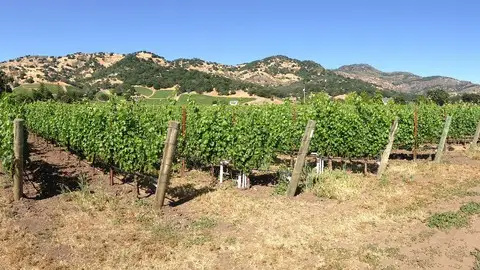
California Napa Valley: photosynthesis levels to detect the risk of wildfires and topographic expansion
What you'll learn
Use QGIS with raster (images with pixels geo localization) and vectors (geo-referenced databases) applied to the vegetable activity.
Different Coordinate Reference Systems depending on the map resolution requirements.
Mark a region on the RASTER layer with Vector defined area to extract statistics. Example photosynthesis levels layer.
Query multiple layers to generate a new map. Example: area with the lowest photosynthesis and lowest soil moisture.
Raster slope tool to find the western face orientation with the highest risk of wildfire expansion. Ex. Mount Whitney and Napa Valley slopes.
Statistical vegetable activity for Napa Valley from 2016 to 2020 to analyze the conditions before and after if wildfires in 2020.
Requirements
Basic trigonometry and geo-location principles.
Description
Apply QGIS to analyze Napa Valley, California vegetable activity, and soil moisture conditions before and after the wildfires in the year 2020. The time period of study is from the year 2016 to 2020.Geographical Information Systems (for example QGIS and ARCGIS) use two main file types:1) Rasters: Images with geo-referenced pixels like GeoTIFF.2) Vectors: Databases with several geo-referenced columns of data. For example distinct types of crops with a geographical address.The Coordinate Reference System (CRS) marks every point in spherical coordinates to give an accurate address taking into account the Earth's curve. Most CRS treats the Earth as a plane creating a distortion in the size of the continents. The choice of the CRS depends on the level of resolution required.Use the principles of Vector files to mark a region of interest over a Raster layer. From here you can create a new Raster layer and extract statistical numbers.We will learn how to create queries of the map layers to get a result. For example, generate a map region with the lowest vegetable activity and soil moisture for Napa Valley County during the year 2020. With the RASTER analysis tools and the Demographic Elevation Model of California, we will find the risk of wildfire expansion due to slope orientation to the west which receives more solar radiation.The Appendix will teach how to download the vegetable activity and soil moisture raster layers from the European Copernicus Sentinel III program website. Also how to download the Demographic Elevation Model from USGS to get the topographical information of any part of the world. Also how to download the RASTER layer of wildfires from the NASA Modis website.We will get the statistics of the vegetable activity of Napa Valley from the year 2016 to 2020 by extracting the statistics from the Raster image by delimiting the region with a vector layer. With this information, we can read the low vegetable activity starting in the year 2018 caused by the droughts and as a risk factor of the wildfires. Then we will read the vegetable conditions after the wildfire event and confirm the extremely low level of vegetable life due to the loss caused by the fire.
Overview
Section 1: Introduction
Lecture 1 Introduction
Section 2: QGis File Types: Raster and Vector
Lecture 2 Part A: Raster and Vector files
Lecture 3 Part B: Raster and Vector Files
Section 3: Coordinate Reference System
Lecture 4 Coordinate Reference System
Section 4: Mark region of interest with Vector Layer and query layers
Lecture 5 Polygons and clip/cut areas of interest in raster and vector layers
Lecture 6 Raster calculator
Lecture 7 Field calculator and query conditions Part A
Lecture 8 Frequency Histogram of Raster layers
Section 5: Wildfires in Napa Valley: Map the vegetable life levels from 2016 to 2020
Lecture 9 Vegetable and soil moisture conditions in Napa Valley from 2016 to 2020
Lecture 10 Wildfire propagation risks: Slope and aspect of the mountain.
Section 6: How to download vegetable activity, soil moisture, wild fires and topography
Lecture 11 Instructions to download the rasters files to analyze
Lecture 12 Exercises to practice the concepts
Technicians that want to extract statistics from geo-referenced images to build a quantitative analysis with reference coordinates.