

Level 11 - Japanese Candlesticks Trading Mastery Program
Level 11 - Japanese Candlesticks Trading Mastery Program
Published 2/2023
MP4 | Video: h264, 1280x720 | Audio: AAC, 44.1 KHz
Language: English | Size: 3.27 GB | Duration: 5h 8m
Published 2/2023
MP4 | Video: h264, 1280x720 | Audio: AAC, 44.1 KHz
Language: English | Size: 3.27 GB | Duration: 5h 8m
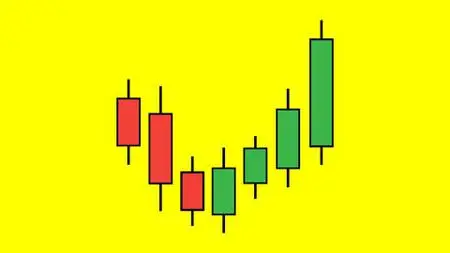
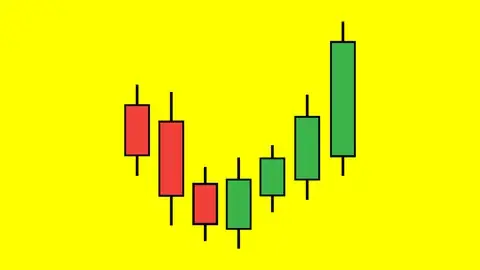
Deep Dive into the Candles with RSI
What you'll learn
Understand the Most Powerful Implications of the RSI Signal
How to Combine W Bottoms with RSI to Spot High Probability Reversal Trades
How to Combine Triple Tops with RSI to Build More Confidence in Your Trading
How to Spot & Trade the RSI Trendline Upside & Downside Breakouts
Using the RSI Failure Swing Method to Enter the Market
Identifying the Most Powerful RSI Signal on the Chart
How to Use RSI to Correctly Identify a Price Upside & Downside Breakout Trade
Avoiding the Premature and False RSI Signals
Use RSI with Multiple Timeframes to Spot the Pullback Trading Opportunities
Requirements
You must have the Willingness to Learn & Study
You must have an Open Mind to New Concepts
You must be Willing to Question Your Existing Beliefs About the Markets & Candle Patterns
You must preferably do Level 1 to 10 of my Japanese Candlesticks Trading Mastery Program
Description
All the Levels of The Japanese Candlesticks Trading Mastery Program are designed to help you : Learn How to Trade Stocks, Forex & Commodities Using Candlesticks & Technical Analysis to Become a Professional Trader–-This is going to be more like a sequel to the Level 10 course.In level 10, I argued that, we can take a normal position size on a continuation trade, but half position size on a reversal trade.This concept gets modified, the moment you add something called as RSI on the reversal trade, because now you have additional confirmation.In this level, we are going to take a deep dive into the RSI, because it is one of the most widely used, popular, yet widely misunderstood and under-utilised indicator.The RSI is one of the simplest, yet one of the most powerful indicators ever invented in technical analysis.My goal for Level 11 is to help you understand each and every aspect of RSI, and how it can be an extremely powerful tool in your trading arsenal, especially helping you build confidence while going for the reversal trades.Here the sub-topics covered in the course: [12 sections] IntroductionIntroductionThe 2 Types of Trades & Position SizesThe RSI & its 3 Main ApplicationsRSI as a Leading IndicatorRSI as a Co-incident Indicator W Bottoms & RSIThe RulesThe W Bottom & RSI Bullish DivergenceThe Bullish Engulfing Pattern at a W BottomA Classic RSI Bullish Divergence at a W BottomA RSI Bullish Divergence without a Candle PatternA W Bottom without a Candle PatternAn Upside Thrust with a RSI Bullish DivergenceRSI Divergence Yet Not a W BottomThe Hammer without a W BottomThe Importance of an RSI DivergenceThe Importance of Position SizeThe Importance of Being CautiousTrading a Low Probability SetupTriple Tops & RSIThe Perfect Triple Top with RSI Divergence The Lower Second TopThe Shooting Star at the Third TopThe Triple Top without a Candle Pattern Lower Highs on the RSI The Non-Ideal Triple Top with RSI Divergence This is Absolutely Not a Triple TopThe Long Period Divergence A Strong Opening at the Third TopThe Break of the Middle BandAlways Keep a Conservative Stop LevelThe Short Signal Below the Lower Band RSI Trendline Upside Breakout RSI Trendline Breakout as a Leading IndicatorRSI Trendline Breakout as a Coincident Indicator The Multi-Testing Price TrendlinePrice Confirmation of a Candle Pattern & RSI BreakoutThe Multi-Tested RSI TrendlineRSI Trendline Downside Breakout The RSI Breakout after a Bearish Divergence The Falling Window RSI Breakout The Trendline That Was Tested 9 TimesThe Imminent Breakout The Importance of a Conservative Stop Loss RSI & Price Upside Breakout The Classic Price Breakout Confirmed by RSI Strength The Rising Window at a Breakout Confirmed by RSI Another Classic Rising Window Breakout & RSI The Importance of RSI StrengthThe Importance of Patience at a Breakout AreaRSI & Price Downside BreakoutRSI Falls Below Reference Line at a Breakout The 2 Falling Window Breakouts with RSI Confirmation A Clear Weakness in the Market An Aggressive Downside Price Breakout The Box Range Breakout Confirmed by RSI WeaknessThe Upside RSI Failure Swing The Rising Window at an Upside Swing The Failure Swing at a Crucial Turning Point The Failure Swing Confirming a Base FormationThe Correct Identification of a Failure SwingWait for a Failure Swing Confirmation The Downside RSI Failure Swing The Downside RSI Failure Swing The Power of a Failure Swing Point The Bearish Divergence Confirmed by a Failure Swing The Falling Window at a Failure SwingThe Importance of Following a CriteriaThe Most Powerful RSI Signals The RSI Bullish Divergence & a Bullish Engulfing PatternThe RSI Bearish Divergence & a Bearish Engulfing PatternThe RSI Bullish Divergence Without any Candle PatternThe RSI Bullish Divergence without a W BottomThe RSI Bullish Divergence & a Bull HaramiPremature RSI Signals The RSI Sell Signal at the Upper BandThe RSI Sell Signal at a Rising WindowThe RSI Sell Signal at the Start of a RallyThe RSI Buy Signal at a Falling WindowThe RSI Buy Signal at the Middle of a DowntrendSpot the Pullbacks Using the RSIThe Weekly Bearish Pullback Confirmed by Daily RSI The Incredible Bullish Move After the RSI CrossLearn concepts that apply to any type of trading. If you know how to read one chart, you can read them all. This course through its various levels will help you understand this unique and most primitive technique of trading. The Japanese Candlesticks Trading Mastery Program can be applied in any or all of the following areas of work :Forex Trading / FX Trading / Currency Trading Stock Trading Commodity Trading Options Trading Futures Trading Intraday Trading / Day Trading Positional Trading Swing Trading Technical Analysis of Stocks, Commodities & CurrenciesPrice Action Trading Chart Pattern Analysis Cryptocurrency Trading Standard Disclaimer : The material presented here is for educational purposes only. Please do proper due diligence. There are risks involved in markets. Returns are never guaranteed. The Japanese Candlesticks are a tool, not a trading system. However, they can be used for any timeframe, any asset class (stocks, commodities & currencies) and any financial instrument (spot, futures & options). The principles discussed in this course are applicable to any market in the world, provided the price information is accurate and is coming from a reliable source. This course is not about which broker you should use or how to use your respective broker platform. This course is about educating you on Japanese Candlesticks in detail so that you can apply these principles in your own market and in your own trading style and timeframe.
Overview
Section 1: Introduction
Lecture 1 Introduction
Lecture 2 The 2 Types of Trades & Position Sizes
Lecture 3 The RSI & its 3 Main Applications
Lecture 4 RSI as a Leading Indicator
Lecture 5 RSI as a Co-incident Indicator
Section 2: W Bottoms & RSI
Lecture 6 The Rules
Lecture 7 The W Bottom & RSI Bullish Divergence
Lecture 8 The Bullish Engulfing Pattern at a W Bottom
Lecture 9 A Classic RSI Bullish Divergence at a W Bottom
Lecture 10 A RSI Bullish Divergence without a Candle Pattern
Lecture 11 A W Bottom without a Candle Pattern
Lecture 12 An Upside Thrust with a RSI Bullish Divergence
Lecture 13 RSI Divergence Yet Not a W Bottom
Lecture 14 The Hammer without a W Bottom
Lecture 15 The Importance of an RSI Divergence
Lecture 16 The Importance of Position Size
Lecture 17 The Importance of Being Cautious
Lecture 18 Trading a Low Probability Setup
Section 3: Triple Tops & RSI
Lecture 19 The Perfect Triple Top with RSI Divergence
Lecture 20 The Lower Second Top
Lecture 21 The Shooting Star at the Third Top
Lecture 22 The Triple Top without a Candle Pattern
Lecture 23 Lower Highs on the RSI
Lecture 24 The Non-Ideal Triple Top with RSI Divergence
Lecture 25 This is Absolutely Not a Triple Top
Lecture 26 The Long Period Divergence
Lecture 27 A Strong Opening at the Third Top
Lecture 28 The Break of the Middle Band
Lecture 29 Always Keep a Conservative Stop Level
Lecture 30 The Short Signal Below the Lower Band
Section 4: RSI Trendline Upside Breakout
Lecture 31 RSI Trendline Breakout as a Leading Indicator
Lecture 32 RSI Trendline Breakout as a Coincident Indicator
Lecture 33 The Multi-Testing Price Trendline
Lecture 34 Price Confirmation of a Candle Pattern & RSI Breakout
Lecture 35 The Multi-Tested RSI Trendline
Section 5: RSI Trendline Downside Breakout
Lecture 36 The RSI Breakout after a Bearish Divergence
Lecture 37 The Falling Window RSI Breakout
Lecture 38 The Trendline That Was Tested 9 Times
Lecture 39 The Imminent Breakout
Lecture 40 The Importance of a Conservative Stop Loss
Section 6: RSI & Price Upside Breakout
Lecture 41 The Classic Price Breakout Confirmed by RSI Strength
Lecture 42 The Rising Window at a Breakout Confirmed by RSI
Lecture 43 Another Classic Rising Window Breakout & RSI
Lecture 44 The Importance of RSI Strength
Lecture 45 The Importance of Patience at a Breakout Area
Section 7: RSI & Price Downside Breakout
Lecture 46 RSI Falls Below Reference Line at a Breakout
Lecture 47 The 2 Falling Window Breakouts with RSI Confirmation
Lecture 48 A Clear Weakness in the Market
Lecture 49 An Aggressive Downside Price Breakout
Lecture 50 The Box Range Breakout Confirmed by RSI Weakness
Section 8: The Upside RSI Failure Swing
Lecture 51 The Rising Window at an Upside Swing
Lecture 52 The Failure Swing at a Crucial Turning Point
Lecture 53 The Failure Swing Confirming a Base Formation
Lecture 54 The Correct Identification of a Failure Swing
Lecture 55 Wait for a Failure Swing Confirmation
Section 9: The Downside RSI Failure Swing
Lecture 56 The Downside RSI Failure Swing
Lecture 57 The Power of a Failure Swing Point
Lecture 58 The Bearish Divergence Confirmed by a Failure Swing
Lecture 59 The Falling Window at a Failure Swing
Lecture 60 The Importance of Following a Criteria
Section 10: The Most Powerful RSI Signals
Lecture 61 The RSI Bullish Divergence & a Bullish Engulfing Pattern
Lecture 62 The RSI Bearish Divergence & a Bearish Engulfing Pattern
Lecture 63 The RSI Bullish Divergence Without any Candle Pattern
Lecture 64 The RSI Bullish Divergence without a W Bottom
Lecture 65 The RSI Bullish Divergence & a Bull Harami
Section 11: Premature RSI Signals
Lecture 66 The RSI Sell Signal at the Upper Band
Lecture 67 The RSI Sell Signal at a Rising Window
Lecture 68 The RSI Sell Signal at the Start of a Rally
Lecture 69 The RSI Buy Signal at a Falling Window
Lecture 70 The RSI Buy Signal at the Middle of a Downtrend
Section 12: Spot the Pullbacks Using RSI
Lecture 71 The Weekly Bearish Pullback Confirmed by Daily RSI
Lecture 72 The Incredible Bullish Move After the RSI Cross
Section 13: Download the Presentation
Lecture 73 Download the Presentation
Salaried Professionals,Doctors,Lawyers,Entrepreneurs,Retirees,Students,Home Makers,Anyone Who is Serious About "Professional Trading as a Way of Earning a Consistent Income from the Markets"