

Univariate Analysis Using R Programming

Univariate Analysis Using R Programming
Published 10/2024
MP4 | Video: h264, 1920x1080 | Audio: AAC, 44.1 KHz
Language: English | Size: 2.08 GB | Duration: 4h 18m
Published 10/2024
MP4 | Video: h264, 1920x1080 | Audio: AAC, 44.1 KHz
Language: English | Size: 2.08 GB | Duration: 4h 18m
Calculate summary statistics of different data types, present them as tables, and create many plots from data.
What you'll learn
Install R and Rstudio
Calculate summary statistics for numerical and categorical data using R
Convert the results to readable tables using R
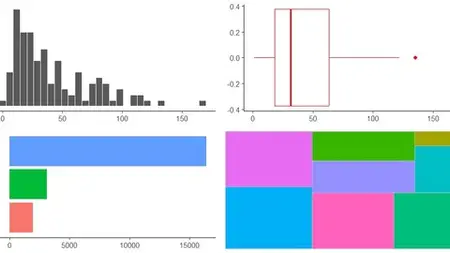
Plot numerical data as histograms and box plots using R
Plot categorical data as bar plots and tree maps using R
Apply the above concepts on freely available datasets
Requirements
No programming language experience is needed. You will learn R and data analysis from scratch.
Description
Install R and R studio.Use R studio to explore data and present the results as tables with captions.Use R studio for calculating summary statistics for the location of numerical data (mean, median, and percentiles).Learn how to use the mean and median to deduce the data distribution.Use R studio for calculating summary statistics for the spread of numerical data (range, variance, standard deviation, and interquartile range). Learn how to interpret the measures of spread to identify your risk.Learn how to present the results of summary statistics as tables with captions.Use R studio for plotting histograms of numerical data. Learn how to interpret the data histogram to deduce the data distribution.Use R studio for plotting box plots of numerical data. Learn how to interpret the data box plot to deduce the data distribution and the different quantiles.Use R studio for calculating summary statistics of categorical data (count, proportion, and percentage).Use R studio for plotting bar plots of categorical data.Use R studio for plotting tree maps of categorical data.Learn how to use the bar plots and tree map to identify the most and least frequent categories.Learn how to customize the plots to produce different versions of the plot for the same data.Learn how to export the created plots to PDF or image or copy them to your clipboard to be included in your reports.
Overview
Section 1: Introduction
Lecture 1 Install R and R studio
Lecture 2 Using R studio
Lecture 3 Data types
Section 2: Numerical data
Lecture 4 Summary statistics for location (mean-median-percentiles)
Lecture 5 Summary statistics for spread (range-variance-standard deviation-IQR)
Lecture 6 Histograms
Lecture 7 Box plots
Section 3: Categorical data
Lecture 8 Summary statistics of categorical data (count and proportion)
Lecture 9 Bar plots
Lecture 10 Tree maps
Laymen persons who want to understand statistics and data analysis,Students or fresh graduates who want to learn R and data analysis,Academic professionals who want to learn statistics to understand the statistical part of published papers