


Learning To See How Ideas Spread: Five Graphs
Learning To See How Ideas Spread: Five Graphs
Published 1/2024
MP4 | Video: h264, 1920x1080 | Audio: AAC, 44.1 KHz
Language: English | Size: 779.42 MB | Duration: 0h 43m
Published 1/2024
MP4 | Video: h264, 1920x1080 | Audio: AAC, 44.1 KHz
Language: English | Size: 779.42 MB | Duration: 0h 43m
Finding the wisdom in five and a half graphs that explain how ideas spread
What you'll learn
The five big ideas: Production adoption, The Chasm, Gartner Hype, The Long Tail, and Positioning
Why we get confused by time and distributions
How to really and truly understand how and way your ideas can spread
The smallest viable audience
Requirements
None
Description
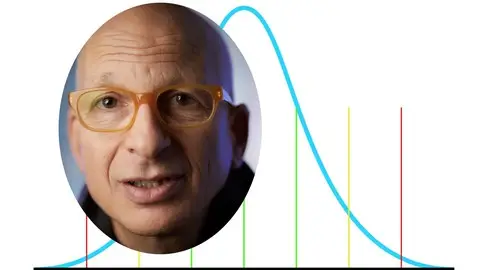
There are five (almost six) graphs that changed the way I see our culture and how our ideas spread:Rogers' Diffusion of InnovationsMoore's Crossing the ChasmThe Gartner Hype CycleAnderson's The Long TailMy take on The Tipand Trout and Ries' work on PositioningEach of these graphs leads to an a-ha, a chance to do better work and to cause the change we seek to make.Often, though, we get stuck. Stuck because it's easy to nod and say we 'get it' but the picture might get in the way of our understanding.This 28 minute course will make it easier to find the wisdom.It also comes with a extra 9 minute rant on the Ideavirus. Along with a link on how to get your copy for free.* * *Seth Godin is the author of some of the bestselling marketing books of all time. In this fast-moving course, he explains the five graphs that give us an innate understanding of how ideas spread, how we find customers and most of all, how we serve people by helping them find what they're looking for. A graph we don't really understand is not the map and guide it could be. This quick course helps you see what you've been missing.
Overview
Section 1: Introduction
Lecture 1 Introduction: The power of seeing
Section 2: The territory and the map
Lecture 2 The territory and the map
Lecture 3 Making time visible
Section 3: The Six (almost five) Graphs
Lecture 4 Standard deviations are standard
Lecture 5 Production adoption and normalcy
Lecture 6 Example: Rogers and Diffusion
Lecture 7 Crossing the chasm
Lecture 8 The Gartner Hype Cycle
Lecture 9 The Dip
Lecture 10 The Long Tail
Lecture 11 Positioning (the one you get to make yourself)
Section 4: EXTRA: The Ideavirus two decades later
Lecture 12 The Ideavirus: 2020
If you want to spread an idea, change the culture, lead a brand, succeed as a freelancer or make your non-profit more successful, it helps to see how it all works.