

Cmt Level 1 Exam Prep Course: Comprehensive Preparation
Cmt Level 1 Exam Prep Course: Comprehensive Preparation
Published 10/2024
MP4 | Video: h264, 1920x1080 | Audio: AAC, 44.1 KHz
Language: English | Size: 18.44 GB | Duration: 46h 52m
Published 10/2024
MP4 | Video: h264, 1920x1080 | Audio: AAC, 44.1 KHz
Language: English | Size: 18.44 GB | Duration: 46h 52m
Unlock the secrets of the markets with our CMT Level 1 Prep Course – Master the art of technical analysis.
What you'll learn
Mastery of chart types such as line, bar, and candlestick charts, along with their practical applications and pitfalls.
In-depth knowledge of Dow Theory, support and resistance levels, and the psychology behind market movements.
Detailed exploration of chart patterns like head and shoulders, double and triple tops/bottoms, wedges, and triangles.
Analyzing various types of gaps, trendlines, and channels to predict market movements.
Understanding of momentum oscillators (MACD, RSI, Stochastic), volume indicators, and their implications on market trends.
Hands-on practice with real-life charts and live trading scenarios using advanced tools like Ichimoku Clouds, Fibonacci retracement, and Elliott Wave analysis.
Key insights into market volatility, options pricing (VIX, put-call parity), and effective risk management strategies for trading.
A thorough grasp of behavioral finance, price movements, and advanced technical analysis strategies like point and figure charting, moving averages.
By the end of the course, students will be well-equipped to analyze markets with technical analysis tools, enhance trading strategies, and prepare for the CMT.
Requirements
Basic Understanding of Financial Markets: While not mandatory, having a general idea about stocks, bonds, and financial markets will be helpful.
Interest in Technical Analysis: A genuine interest in learning how to analyze and predict market movements using charts and technical indicators is key.
No Prior Experience Required: The course is designed for beginners, so no prior experience with technical analysis or trading is needed.
Access to a Computer: Students will need a computer or device with internet access to follow the course and practice with charting tools.
Optional Trading Platform/Charting Tool: Though not required, students may benefit from using a charting platform or trading software for hands-on practice (e.g., TradingView or MetaTrader).
Description
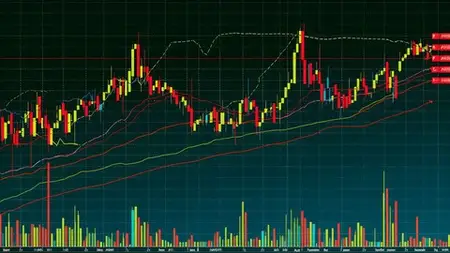
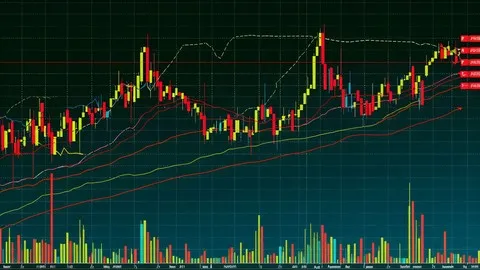
Introduction:This course is designed to thoroughly prepare candidates for the Chartered Market Technician (CMT) Level 1 exam. The curriculum is aligned with the core principles of technical analysis, equipping learners with the knowledge required to understand and interpret charts, price patterns, and market behavior. Whether you are a beginner looking to explore technical analysis or an experienced trader aiming to solidify your knowledge, this course will help you navigate through the critical concepts of market trends, charting, indicators, and volume analysis.Section 1: Understanding Key Technical Analysis ConceptsThe first section delves deep into foundational concepts essential for the CMT Level 1 exam. Starting with the basics, it covers the use of various chart types such as line charts, bar charts, and candlestick charts, along with their pitfalls. You'll explore Dow Theory, a cornerstone of trend analysis, followed by a detailed study of support and resistance levels, providing clarity on market dynamics. Lectures dedicated to candlestick patterns teach practical techniques to interpret short and long patterns, Doji formations, and shadows, which are crucial for recognizing price reversals. Additionally, this section introduces reversal patterns like Head and Shoulders, Double Tops and Bottoms, and Triple Tops, explaining their psychological underpinnings and volume signals, which offer a nuanced understanding of market trends. Hands-on exercises reinforce the theoretical concepts, enabling learners to identify and analyze these patterns effectively.Section 2: Chart Patterns and TrendlinesIn the next phase, you will explore the structure and significance of trendlines and channels, including different trendline types such as linear and logarithmic scales. Understanding how to utilize these tools is vital for pinpointing market trends and making informed decisions. Further, we dive into patterns like the rising and falling wedges, ascending and descending triangles, and symmetrical triangles, explaining their importance in predicting market behavior. You will also learn how to recognize rectangle patterns and work with trend channels, adding valuable tools to your technical analysis toolkit.Section 3: Gaps and OscillatorsThis section introduces gap analysis, one of the most important technical signals. You'll learn to distinguish between different gap types, including breakaway, runaway, and exhaustion gaps, and their implications for market trends. After mastering gap analysis, you will delve into momentum oscillators such as the Relative Strength Index (RSI), stochastic oscillators, and MACD (Moving Average Convergence Divergence), key indicators for identifying overbought or oversold market conditions. Practical chart exercises enhance understanding, giving learners the ability to apply these oscillators in real-time market scenarios.Section 4: Volume and Market Sentiment IndicatorsVolume plays a crucial role in confirming trends and identifying reversals. This section covers various volume-based indicators, such as On-Balance Volume (OBV) and the Accumulation/Distribution line, that help detect subtle shifts in market sentiment. Additionally, you will explore money flow indices and the Chaikin Money Flow, which provide deeper insights into institutional buying and selling pressures. Lectures also focus on analyzing volatility, with topics like implied volatility, open interest, and the VIX (Volatility Index). The importance of sentiment indicators and their influence on market movements is emphasized through practical chart exercises.Section 5: Advanced Elliott Wave and Fibonacci AnalysisIn this advanced section, the course provides comprehensive coverage of Elliott Wave Theory, detailing key concepts like impulse waves, corrective waves, and extensions. You'll also learn how to apply Fibonacci retracement tools in combination with Elliott Waves to predict price targets and reversals. The lectures on wave psychology will improve your ability to interpret market cycles and trade breakouts more effectively.Section 6: Risk Management and Behavioral FinanceThe final section tackles the critical aspect of risk management and behavioral finance. Topics like trading psychology, emotional biases, and effective risk control are discussed in depth to prepare traders for the mental challenges they may face in the market. Efficient Market Hypothesis (EMH) and the Random Walk Theory are also covered, providing an academic perspective on market efficiency and price movements. The course rounds out with practical sessions on trading strategies that integrate chart patterns and technical indicators for improved decision-making.Conclusion:The Mastering Technical Analysis for CMT Level 1 course offers a structured, in-depth exploration of the key technical analysis concepts needed to excel in the CMT Level 1 exam. Through a combination of theory, practical exercises, and real-world chart applications, this course equips you with the analytical skills and confidence to interpret market movements and develop robust trading strategies.The CMT (Chartered Market Technician) Level 1 Exam is the first of three exams required to earn the CMT designation, which is focused on technical analysis and is administered by the CMT Association. The CMT designation is highly recognized in the field of financial markets, especially for professionals involved in trading, portfolio management, and research.Here’s a breakdown of what you need to know about the CMT Level 1 Exam:1. Purpose and Focus:The CMT Level 1 exam assesses the candidate's basic knowledge of technical analysis. It introduces core concepts that will be built upon in subsequent levels.The exam focuses on the terminology and tools of technical analysis, ensuring that candidates understand the foundational aspects of the field, including chart construction, patterns, trends, and indicators.2. Key Topics Covered:Basic Charting: How to create and interpret different types of charts (line, bar, candlestick).Trends: Understanding market trends (uptrend, downtrend, sideways), trendlines, and trend reversal patterns.Support and Resistance: Key levels in technical analysis that indicate where price changes may occur.Chart Patterns: Recognizing classic chart patterns like head and shoulders, triangles, flags, and pennants.Technical Indicators: Introduction to various technical indicators such as moving averages, MACD, RSI (Relative Strength Index), and Bollinger Bands.Volume and Open Interest: How to use volume and open interest to confirm price movement.Market Cycles and Phases: Basic understanding of different market phases (accumulation, distribution, etc.).Sentiment Indicators: Tools to gauge market sentiment such as investor surveys, put/call ratios, and more.Dow Theory: Introduction to one of the founding theories of technical analysis.Elliott Wave Theory (Basics): Introduction to wave structures and patterns.Risk Management: Basic risk management techniques, including stop-loss orders and position sizing.Ethics and Professional Responsibility: Overview of ethical considerations in market analysis.3. Exam Format:Question Type: Multiple choice (with 4 possible answers for each question).Number of Questions: The exam typically has around 132 questions.Duration: 2 hours and 15 minutes.Passing Score: The passing score is usually set based on the performance of the cohort, but it is not fixed at a specific percentage.Computer-Based: The exam is taken on a computer at designated testing centers or sometimes remotely (depending on location and circumstances).4. Study Materials:CMT Curriculum: The official curriculum provided by the CMT Association is the primary resource for preparing. It includes textbooks and study guides covering all exam topics.Practice Exams: The CMT Association and other providers offer practice exams to help candidates familiarize themselves with the format and types of questions asked.Study Groups and Courses: Many candidates join study groups or enroll in online courses that offer additional support and resources.5. Exam Registration and Fees:You need to be a member of the CMT Association to register for the exam. Membership fees are separate from the exam registration fees.As of recent years, the cost for the Level 1 exam is around $395 to $595 depending on the registration period (early, standard, or late registration).6. Who Should Take the CMT Level 1:The CMT Level 1 exam is ideal for individuals pursuing a career in technical analysis, portfolio management, trading, or any role that involves understanding market trends and price action.It is especially relevant for:Equity and FX tradersTechnical analystsPortfolio managersRisk managersMarket researchersAsset and wealth managers7. Preparation Tips:Understand the Basics: Since this is the introductory level, focus on mastering the fundamentals of technical analysis.Use the Official Curriculum: Stick to the official materials provided by the CMT Association to ensure you cover the exam's scope comprehensively.Practice Questions: Regular practice with sample questions will help you get familiar with the type of questions asked and improve your time management during the actual exam.Consistency: Establish a regular study routine, and don’t cram close to the exam. Most candidates spend 80-100 hours preparing for the CMT Level 1.8. Next Steps:After passing Level 1, candidates can proceed to CMT Level 2, which delves deeper into technical analysis with more applied knowledge and testing of your analytical skills.Overall, the CMT Level 1 exam is a gateway into understanding the theory and practice of technical analysis, setting the foundation for more advanced studies in the field of market behavior and trading strategies.
Overview
Section 1: CMT Level 1
Lecture 1 Introduction to CMT Level 1 - Prep Course
Lecture 2 Line Chart and Bar Chart
Lecture 3 Candlestick Chart and Pitfall
Lecture 4 Pitfall Candlestick Concluded
Lecture 5 Dow Theory
Lecture 6 Support and Resistance
Lecture 7 More Details On Support and Resistance
Lecture 8 Types of candlestick Patterns
Lecture 9 Practicals of Short and Long Candlestick Patterns
Lecture 10 Types of Doji Candlestick Patterns
Lecture 11 Long Upper and Lower Shadows
Lecture 12 Long Lower Shadows Only
Lecture 13 Introducation to Reversal Patterns
Lecture 14 Continuation of Head and Shoulder Top
Lecture 15 Head and Shoulder Top Psychology
Lecture 16 Variations and Facts of H and S Top
Lecture 17 Features and Characteristics of Head and Shoulder
Lecture 18 Learn Double Bottom
Lecture 19 DB Psychology and Volume
Lecture 20 Four Types of Double Bottom
Lecture 21 Market with Alphabets Double Bottom
Lecture 22 Continue on Market Alphabets Double Bottom
Lecture 23 Triple Bottom - Introduction
Lecture 24 Triple Bottom - Variations
Lecture 25 Triple Bottom - Psychology and volume
Lecture 26 Triple Bottom - Exercise
Lecture 27 Learn Double Top
Lecture 28 Double Tops R- Com Chart
Lecture 29 Four Types of Double Tops
Lecture 30 Understanding Variations
Lecture 31 Facts of Double Tops
Lecture 32 Identifying Double Tops
Lecture 33 Triple Top (TT)
Lecture 34 Triple Tops Psychology and Volume
Lecture 35 Triple Tops Psychology and Volume Continue
Lecture 36 Rising wedge
Lecture 37 Falling Wedge
Lecture 38 Minor High
Lecture 39 Minor Lows
Lecture 40 Trendline and Channels
Lecture 41 Slope of Trendline
Lecture 42 Linear and Logarithmic Scale
Lecture 43 Types of Trendlines
Lecture 44 Importance of Trendlines
Lecture 45 Trend Channels
Lecture 46 Introduction to Rectangle Pattern
Lecture 47 Explained Different Concepts with Chart
Lecture 48 Different Concepts with Chart Continues
Lecture 49 Variation and Exercise
Lecture 50 Variation and Exercise Continue
Lecture 51 Ascending Triangle
Lecture 52 Important Point of Ascending Triangle
Lecture 53 Ascending - Pyschology and Exercise
Lecture 54 Pyschology and Exercise Continues
Lecture 55 Introduction to Descending Triangle
Lecture 56 Explained Different Concept with Chart
Lecture 57 Different Concept with Chart Continues
Lecture 58 Daily Pattern Char
Lecture 59 Introduction to Symmetrical Triangle
Lecture 60 Symmetrical Triangle - Psychology
Lecture 61 Different concept of Symmetrical Triangle
Lecture 62 Symmetrical Triangle Exercise
Lecture 63 Introduction to Flag
Lecture 64 Falg and Penants
Lecture 65 More on Falg and Penants
Lecture 66 Important Points of Flag
Lecture 67 Exercise Penants
Lecture 68 Introduction to GAP
Lecture 69 Explain Gap up and Gap Down
Lecture 70 Common Gap
Lecture 71 Practical Implication with Chart
Lecture 72 Breakaway Gap
Lecture 73 Breakaway Gap with implication with Chart
Lecture 74 Runaway Gap and Continuation Gap
Lecture 75 Runaway Gap implication with Chart
Lecture 76 Exhaustion Gap
Lecture 77 More on Exhaustion Gap
Lecture 78 Exhaustion Gap Implication with Chart
Lecture 79 Two Types of Technical Analysis
Lecture 80 Introduction to Momentum Oscillator
Lecture 81 More on Momentum Oscillator
Lecture 82 Leading and lagging Indicator Explained
Lecture 83 Leading and lagging Indicator Explained Continues
Lecture 84 Relative Strength Index
Lecture 85 Overbought and Over Sold Explanation
Lecture 86 Explained Divergence
Lecture 87 Explanation on chart and Exercise
Lecture 88 Introduction to Moving Average (MA)
Lecture 89 Explanation on chart (MA)
Lecture 90 Exponential Moving Average
Lecture 91 Elements of MACD
Lecture 92 Explanation on chart (MACD)
Lecture 93 MACD Crossover
Lecture 94 MACD Divergences
Lecture 95 Stochastic Oscillator
Lecture 96 Stochastic Formula
Lecture 97 Ranging Markets
Lecture 98 Stochastic Oscillator Different Concept
Lecture 99 Stochastic Oscillator Chart
Lecture 100 Money Flow Introduction and Explanation
Lecture 101 Money Flow index Introduction and Explanation
Lecture 102 Money Flow index Explain Formula on Excel
Lecture 103 Money Flow index Explanation on Charts
Lecture 104 Money Flow index Explanation of Failure Swing on Chart
Lecture 105 Explain Accumulation Distribution
Lecture 106 Accumulation Distribution Formula
Lecture 107 Formula and Practical Chart
Lecture 108 Introduction to Chaikin Money Flow
Lecture 109 Chaikin Money Flow Calculation
Lecture 110 Practical Implication on Chart
Lecture 111 Chart Explanation Continues
Lecture 112 Explanation of Ichimoku Cloud
Lecture 113 Analyzing Trend
Lecture 114 Analyzing Uptrend
Lecture 115 Ichimoku Cloud Downtrend
Lecture 116 Identifying Trend
Lecture 117 Practical chart Implication
Lecture 118 Practical chart Implication Continues
Lecture 119 Explain On Balance Volume
Lecture 120 Balance Volume Interpretation
Lecture 121 Characteristic of OBV
Lecture 122 Trading Signals
Lecture 123 Practical Explanation on Chart
Lecture 124 Practical Explanation on Chart Continues
Lecture 125 What is Volatility
Lecture 126 Implied Volatility
Lecture 127 Implied Volatility Continues
Lecture 128 Explain Put Call Parity
Lecture 129 Put and Call Option
Lecture 130 Explain Put Call Parity with Table
Lecture 131 Explain Put Call Parity with Table Continues
Lecture 132 Explain Pricing Calculators
Lecture 133 Pricing Calculators and Other Tools
Lecture 134 Fluctuations Based on Supply and Demand
Lecture 135 Fluctuations Based on Supply and Demand Continues
Lecture 136 Impact on Option Prices
Lecture 137 Implied Volatility and option Prices
Lecture 138 VIX - Introduction and Explanation
Lecture 139 Explain VIX and Put-Call Parity
Lecture 140 Explain VIX and Put-Call Parity Continue
Lecture 141 VIX - VIX and Market Movement
Lecture 142 VIX - VIX and Market Movement Continue
Lecture 143 Open Interest - Introduction and Explanation
Lecture 144 Open Interest - Crowd Psychology and Trading Rules
Lecture 145 Open Interest and Implied volatility Live Example
Lecture 146 Introduction to Wave Principle
Lecture 147 Wave Principle Explanation
Lecture 148 Corrective Phase
Lecture 149 Important Rules of Elliott Wave
Lecture 150 Impulse Pattern
Lecture 151 Elliott Wave Degree
Lecture 152 Explain Complete Market Cycle
Lecture 153 Explain Extension
Lecture 154 Different Types of Extension
Lecture 155 Third and Fifth Wave Extension
Lecture 156 Third and Fifth Wave Extension Continue
Lecture 157 Ending Diagonal
Lecture 158 Leading Diagonal
Lecture 159 Fibonacci Numbers
Lecture 160 Fibonacci Retracement
Lecture 161 Fibonacci Retracement Continues
Lecture 162 Corrective Waves
Lecture 163 Corrective waves Continue
Lecture 164 Double ZigZag
Lecture 165 Irregular Expanded Flat
Lecture 166 Running Flat
Lecture 167 Triangle and Combination
Lecture 168 Triangle and Combination Continues
Lecture 169 Explain Fibonacci Relationship
Lecture 170 Explain Fibonacci Relationship Continues
Lecture 171 Fibonacci Multiple for Flats
Lecture 172 Expanded Flats
Lecture 173 Explain Anatomy Elliott Wave Trading
Lecture 174 Improve Trading Through Elliott Wave
Lecture 175 Improve Trading Through EW Continues
Lecture 176 Determining Maturity of Trend
Lecture 177 Providing Specific Points Invalidation
Lecture 178 Four Best Waves to Trade
Lecture 179 Trade on Break of Patterns
Lecture 180 Trade on Break of Patterns Continues
Lecture 181 Ending Diagonal 1
Lecture 182 Aggressive Approach - Break of Zigzag
Lecture 183 Triangle Pattern
Lecture 184 Risk Management
Lecture 185 The Psychology of Trading
Lecture 186 Explain Basic of EMH
Lecture 187 What is EMH
Lecture 188 Strong form of the EMH
Lecture 189 Random Walk and Martingale Hypothesis
Lecture 190 Expected Future Stock Price
Lecture 191 Characteristics and Construction
Lecture 192 Point and Figure Chart
Lecture 193 Point and Figure Chart Continues
Lecture 194 Explain 1 Box Reversal Chart
Lecture 195 More on 1 Box Reversal Chart
Lecture 196 Explain 1 Box and 3 Box Reversal Chart
Lecture 197 3 Box Reversal Chart Continues
Lecture 198 Explain 5 Box and 2 Reversal Chart
Lecture 199 Point and Figure Chart Formation
Lecture 200 Trendline on Point and Figure Chart
Lecture 201 Point and Figure Trading Techniques
Lecture 202 Horizontal Count
Lecture 203 Vertical Count
Lecture 204 Explain Risk and Return
Lecture 205 The CAPM Equation
Lecture 206 The CAPM Equation Continues
Lecture 207 Seasonality and Calendar Patterns
Lecture 208 Explain Seasonality
Lecture 209 Explain Seasonal Pattern
Lecture 210 Cycle Analysis and Basics
Lecture 211 Understand Business Cycle
Lecture 212 The Kondratieff Wave
Lecture 213 Revision of Dow Theory and Candlestick Patterns
Lecture 214 Reversal Patterns
Lecture 215 Reversal Patterns and Trendline and Channels
Lecture 216 Revision of Continuation Patterns
Lecture 217 Understand Indicators
Lecture 218 Money Flow
Lecture 219 Understanding Volatility and its Types
Lecture 220 Introduction to the Wave Principle
Lecture 221 Elliott Wave and Fibonacci
Lecture 222 Anatomy of Elliott Wave Trading
Lecture 223 Practice on Live Charts
Lecture 224 Practice on Live Charts Continues
Lecture 225 Identifying Patterns Using Live Chats
Section 2: CMT Part 1 Updates
Lecture 226 Introduction to Basics of Technical Analysis
Lecture 227 Basics of Trend Analysis
Lecture 228 Trends, Peaks and Troughs
Lecture 229 Range Trading
Lecture 230 Trend Lines
Lecture 231 Trend Lines Continue
Lecture 232 Breakouts Part 1
Lecture 233 Breakouts Part 2
Lecture 234 Breakouts Part 3
Lecture 235 Types and Strategies
Lecture 236 Types and Strategies Continue
Lecture 237 Directional Movements
Lecture 238 Bands and Envelopes
Lecture 239 Behavioral Finance
Lecture 240 Behavioral Finance Continued
Lecture 241 Double Top and Bottom
Lecture 242 Rectangles
Lecture 243 Triangles
Lecture 244 Rounded Edge Patterns
Lecture 245 Short Term Basics
Lecture 246 Gaps
Lecture 247 Reversal Patterns
Lecture 248 Bar Reversal Patterns
Lecture 249 Bar Reversal Patterns Continued
Lecture 250 Pattern Rankings
Lecture 251 Volume Terminology
Lecture 252 Importance of Volume Analysis
Lecture 253 Volume Indicators Concepts
Lecture 254 Volume Indicators Charts
Lecture 255 Volume and Open Interest
Lecture 256 Volume Principals
Lecture 257 Volume Indicators
Lecture 258 Candlestick Essentials
Lecture 259 Candlestick Essentials Continued
Lecture 260 Point and Figure Charateristics
Lecture 261 Reversal and Trendlines
Lecture 262 Point and Figure Patterns
Lecture 263 Point and Figure Patterns Continued
Lecture 264 Point and Figure Trading
Lecture 265 Basics of Charting Concepts
Lecture 266 Confirmation and Divergence
Lecture 267 Market Breadth
Lecture 268 Oscillators
Lecture 269 Oscillators Continued
Lecture 270 Price Chart
Lecture 271 High Low Indicators
Lecture 272 Moving Averages
Lecture 273 Characteristics of Cycle
Lecture 274 Principals of Commonality
Lecture 275 Tools for Fixed Cycle Analysis
Lecture 276 Natural Cycles
Lecture 277 Notable Cycles
Lecture 278 Notable Cycles Continued
Lecture 279 Basics of Markets and Volatility
Lecture 280 Data and Technical Analyst
Lecture 281 Equity Markets
Lecture 282 Equity For Technical Analyst
Lecture 283 Indexes for Technical Analyst
Lecture 284 Indexes for Technical Analyst Continued
Lecture 285 Fixed Income Securities
Lecture 286 Fixed Income For Technical Analyst
Lecture 287 Futures Market
Lecture 288 Futures for Technical Analyst
Lecture 289 Futures For Technical Analyst Continued
Lecture 290 ETPS for Technical Analyst
Lecture 291 Currency Market
Lecture 292 Currencies for Technical Analyst
Lecture 293 Options Market
Lecture 294 Options for Technical Analyst
Lecture 295 Understanding Implied Volatility
Lecture 296 Put Call Parity
Lecture 297 Events and Implied Volatility
Lecture 298 Vix Index
Lecture 299 Introduction to Behavioral Finance
Lecture 300 Law of one Price
Lecture 301 Fungibility
Lecture 302 Noise Traders
Lecture 303 Noise Trading Academic Views
Lecture 304 Trend Following Noise Traders
Lecture 305 Herd Instinct Models
Lecture 306 Sentiment Drives Market Price
Lecture 307 Smart Money
Lecture 308 Commitment of Traders
Lecture 309 Insider Trading
Lecture 310 Short Interest
Lecture 311 Investor Surveys
Lecture 312 External Sentiment Sources
Lecture 313 Basics of Statistics
Lecture 314 Descriptive Summary Statistics
Lecture 315 Anscombe Quartet
Lecture 316 Probability Distributions
Lecture 317 Normal Distribution and Variation
Lecture 318 Basics of Technical Trading Systems
Lecture 319 Objective Rules
Lecture 320 Benchmarking
Lecture 321 Trading Bias
Lecture 322 Being Right
Lecture 323 Making Money
Lecture 324 Stories of Winners
Lecture 325 Davis Laws
Lecture 326 Model Building Process
Lecture 327 Model Building Process Continued
Lecture 328 Relative Strength Model
Aspiring Traders and Investors: Individuals looking to enhance their trading skills and understand market behavior through technical analysis.,Finance Students: Students pursuing degrees in finance, economics, or related fields who want to supplement their academic knowledge with practical skills in technical analysis.,Financial Professionals: Professionals working in finance, such as financial advisors, asset managers, or analysts, seeking to deepen their understanding of technical analysis to better serve clients or make informed investment decisions.,Self-directed Investors: Individuals who manage their own investment portfolios and want to learn effective techniques for analyzing price movements and trends.,Anyone Interested in Technical Analysis: Anyone curious about learning how to read charts, understand technical indicators, and apply technical analysis principles to improve their trading strategies.